Figures & data
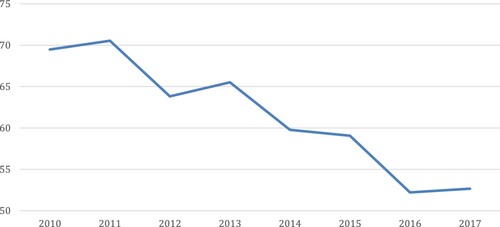
Figure 1. Inclusion of positive green and negative non-green window guidance targets in the PBC's quarterly reports’, 2005 Q1-2020 Q2.
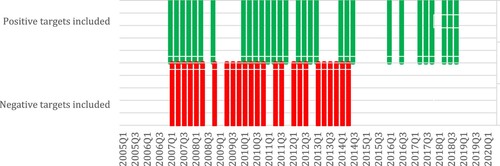
Figure 2. Relative position of the section on window or credit guidance in the PBC's quarterly reports’ monetary policy section, 2005–2020. Note: See Table 2A for details.
Note: Policy instruments that occurred irregularly are not included. Source: Compiled by authors based on the PBC’s quarterly monetary policy reports.
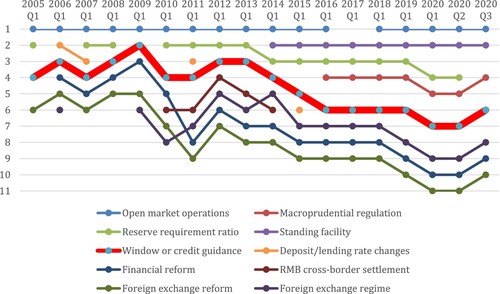
Figure 3. Total finance as percentage of GDP, 1996–2017. Source: Compiled by authors with data from the World Bank Financial Development Index database.
Figure 4. Inflation, consumer prices and GDP per capita growth (annual %) in China, 1999–2019. Sources: Compiled by authors with data files from the World Bank national accounts data, OECD National Accounts, International Monetary Fund and International Financial Statistics and data files.
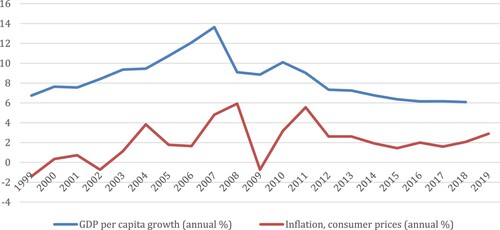
Figure 5. New clean energy investment in China in billion US$, 2006–2020. Data: Compiled by authors with data from Bloomberg New Energy Finance.
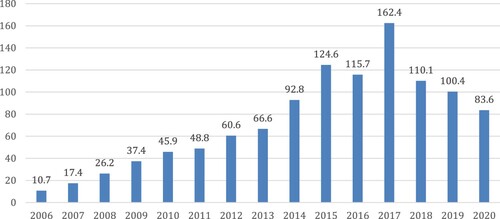
Figure 6. Total primary energy supply (TPES) by source in kilotonnes of oil equivalent (ktoe) in China, 1990–2018. Source: IEA, World Energy Balances 2020.
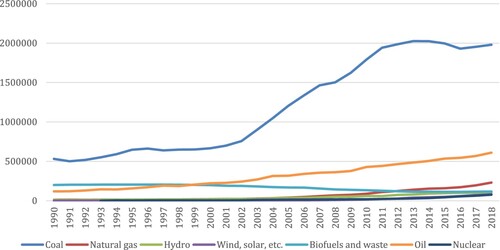
Figure 7. PM2.5 air pollution, mean annual exposure (micrograms per cubic meter) in China, 2005–2017. Data: Compiled with data from the World Bank.