
Figures & data
Figure 1. Greenhouse gas emissions from agriculture in Ethiopia in MtCO2eq. (Source: FAOSTAT, Citation2021).
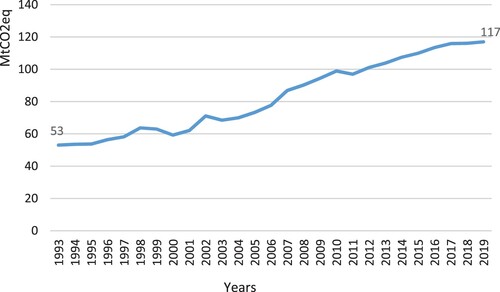
Figure 2. Study region where data was collected.
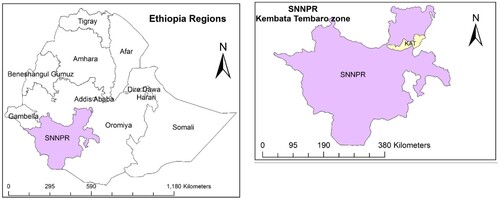
Figure 3. Workshop participants per stakeholder type (N = 36).
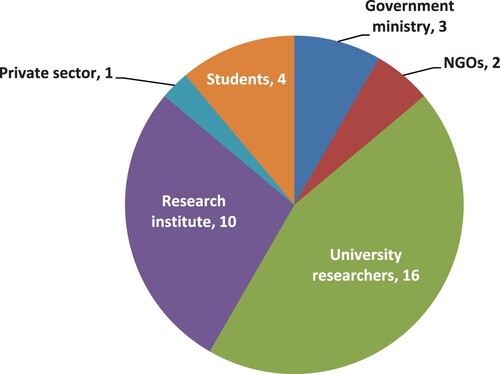
Table 1. Summary of field data collected on climate, land use, land use and land cover change, management practices applied in cropland, livestock and agroforestry, and farm products.
Figure 4. Greenhouse gas emissions per hectare from synthetic fertilizer application in wheat, barley and potato in t CO2eq ha−1 (N = 25).
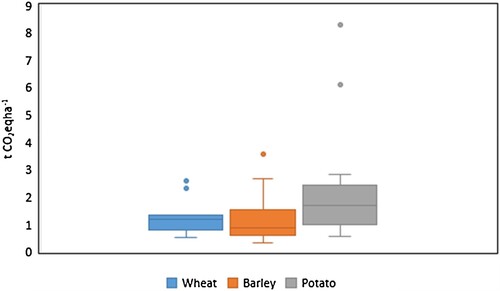
Figure 5. Greenhouse gas emissions from livestock production (enteric fermentation, manure management and feed) in tCO2eq ha−1 (N = 25 farmers).
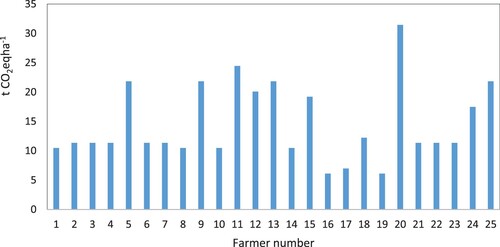
Figure 6. Screenshot of the MOT presenting a suggested list of mitigation options and mitigation potential (in kg CO2eq ha−1 yr−1) for farmer 1.
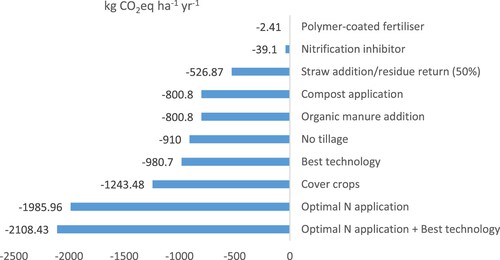
Table 2. Total mitigation potential of manure application in wheat production across the 25 farmers.