
Figures & data
Figure 1. Conceptual framework (adapted from Geels (Citation2014)).
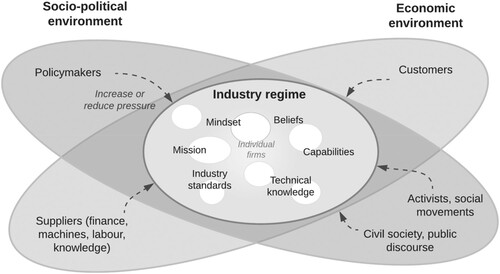
Table 1. Major European IOCs included in the analysis.
Table 2. Data types and sources used in the analysis.
Table 3. Developments in international and European policymaking from 2005 to 2019 relevant to the oil industry.
Figure 2. The evolution of the economic (task) environment (2005–2019).
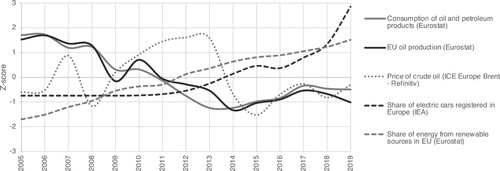
Figure 3. The IOCs response to decarbonisation.
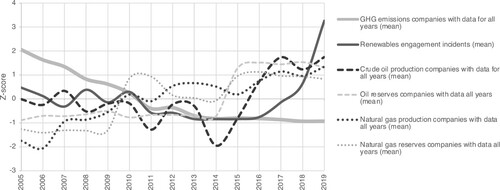
Figure 4. IOCs’ engagement incidents with renewables, low-carbon fuels, and CCS.
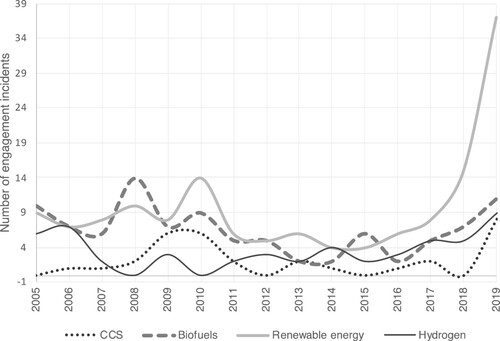
Table 4. Dynamics between the external environment and IOCs (additional pressure and climate action – green, reduction of pressure and climate action – red).
Supplemental material