Figures & data
Figure 1. Total Expenditures by Visitors and Residents by Sector. Note: Visitor spending on gasoline is included in the petroleum category and is not visible in the figure as it is less than 1% of spending on petroleum products.
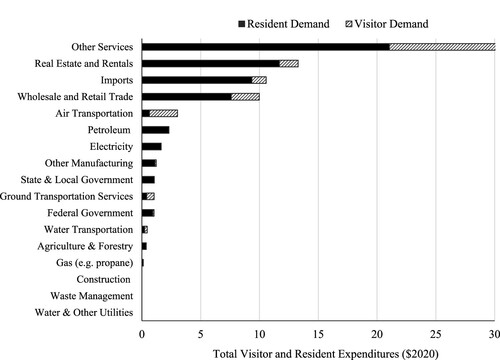
Table 1. Percentage of Household Expenditures by Sector by Income Group.
Figure 2. GHG Intensity of Economic Sectors with GHG Emissions at least 0.01 MMtCO2e/$Billion.Footnote16
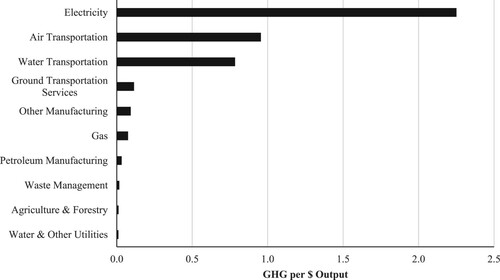
Table 2. US Federal Social Cost of Carbon, 2025–2045 ($2020/MtCO2e).
Figure 3. Baseline GHG Emissions by Sector (MMtCO2e).
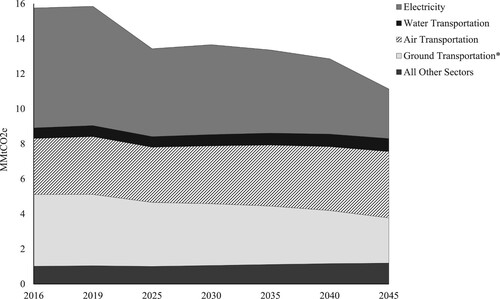
Figure 4. Change in GHG Emissions from the Baseline by Sector (SCC with Government Spending), MMtCO2e. *Includes ground transportation services and personal vehicle travel.
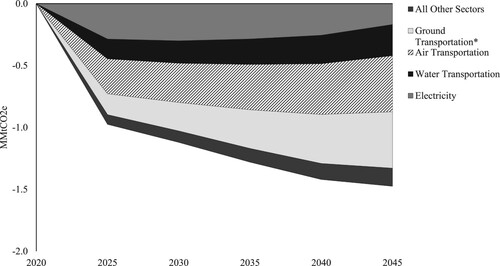
Figure 5. Economic Impacts of the Carbon Tax (SCC with government spending), Percent Change from Baseline.
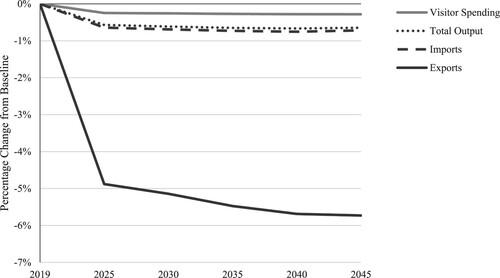
Table 3. Share of Total Tax Revenue Paid by Visitors.
Figure 6. Source-Side, Use-Side and Net Welfare Change from Baseline by Income Quintile (SCC with Equal-Share Dividends).
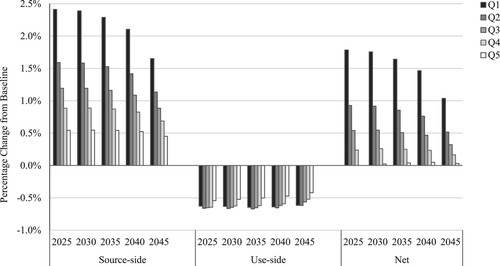
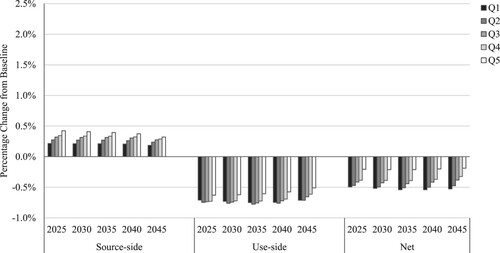
Figure 7. Source-Side, Use-Side and Net Welfare Change from Baseline by Income Quintile (SCC with Government Spending).