Figures & data
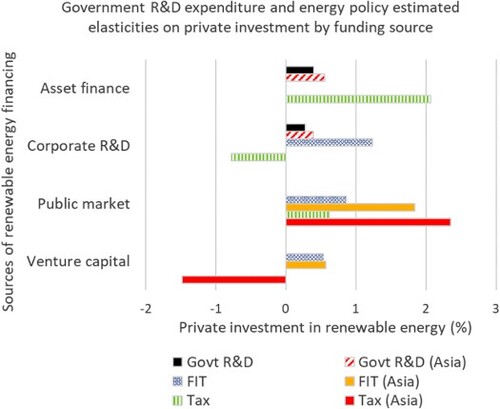
Figure 1. Investments in energy transition technologies. Note: CCS – carbon capture and storage. Investment in CCS is available from 2018, electrified transport from 2016. Renewable energy includes wind, solar, biofuels, biomass & waste, marine, geothermal and small hydro. Source: Authors’ own using data from BloombergNEF (Citation2020).
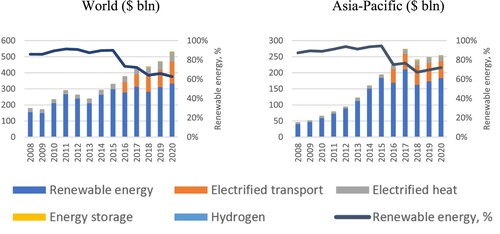
Figure 2. Investment in renewable energy. Notes: Renewable energy includes wind, solar, biofuels, biomass & waste, marine, geothermal and small hydro. Source: Authors’ own using data from BloombergNEF (Citation2020).
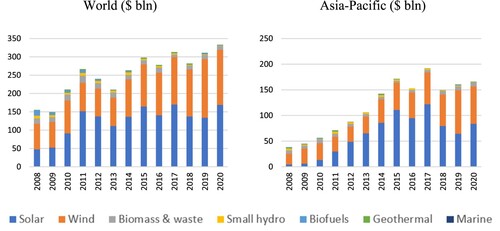
Figure 3. Sources of financing and technology maturity. Source: Authors’ own using Frankfurt School-UNEP Centre/BNEF (Citation2020, p. 58)
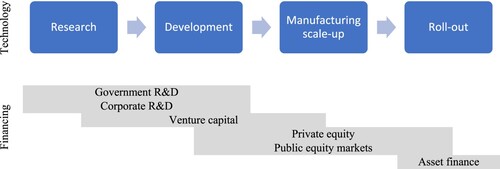
Figure 4. Private financing structure in renewable energy (by year) Note: Please refer to Table A1 in the Appendix for definitions of the sources of financing. Source: Authors’ own using data from BloombergNEF (Citation2020).
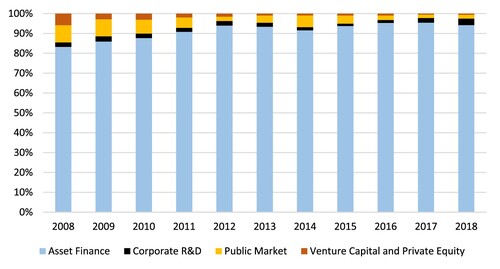
Figure 5. Private financing structure in renewable energy (by country). Source: Authors’ own using data from BloombergNEF (Citation2020).
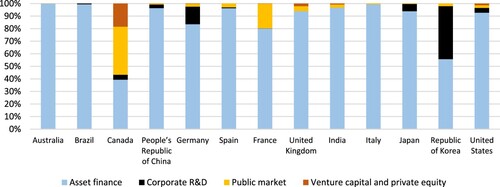
Figure 6. Private financing structure in renewable energy (by technology). Source: Authors’ own using data from BloombergNEF (Citation2020).
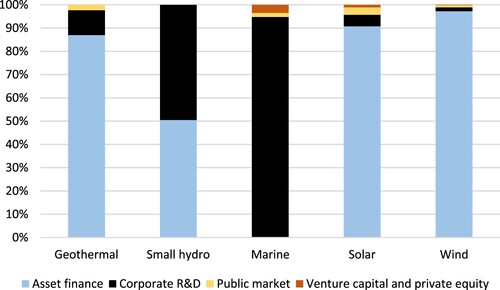
Table 1. Renewable energy capacity.
Table 2. Descriptive statistics.
Table 3. Multi-level variables.
Table 4. The determinants of private investment in renewable energy by funding source: country, sector and time fixed effects.
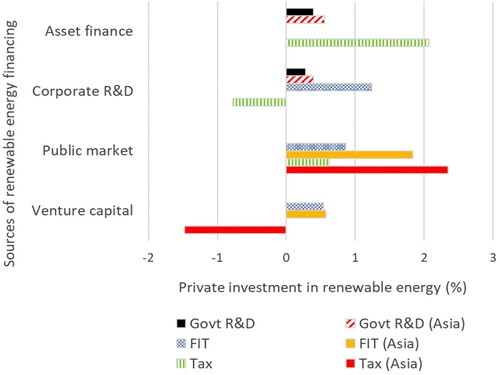
Figure 7. Government R&D expenditure and energy policy estimated elasticities on private investment by funding source. Source: Authors’ estimation based on Equation (1).