
Figures & data
Table 1. Types of images.
Table 2. Interactions according to the type of image (mean).
Figure 1. Example of an image with ‘real people’. Source: @DaveOCKOP.

Figure 2. Example of an image that contains the basis for a story. Source: @JakelinTroy.

Figure 3. Example of an image that shows ‘powerful impacts’. Source: @ClimateReality.
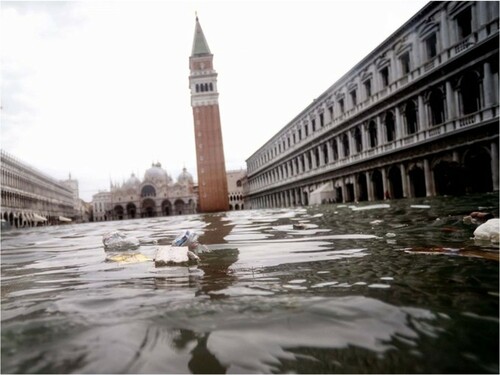
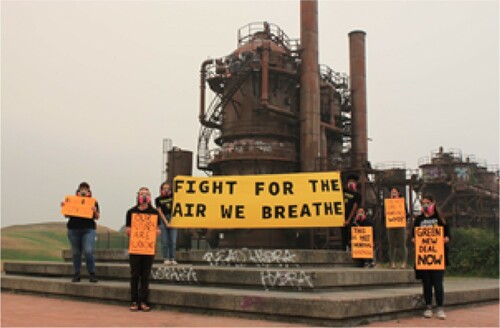
Figure 4. Example of an image of protests by people who are directly affected. Source: @xnclejessie.
Supplemental material