
Figures & data
Figure 1. Impulse response functions for an impulse (i.e. one unit increase) in WTI on total provincial employment under different specifications. Uncertainty bands represent a bootstrapped 95% confidence interval.
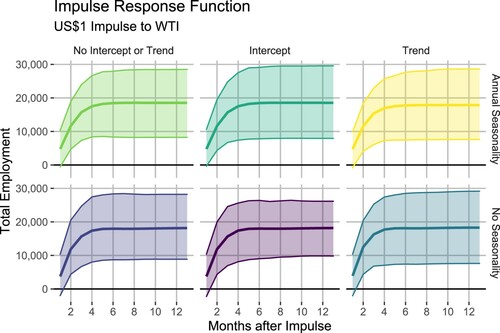
Figure 2. Impulse response functions for an impulse in the discount on total provincial employment under different specifications.
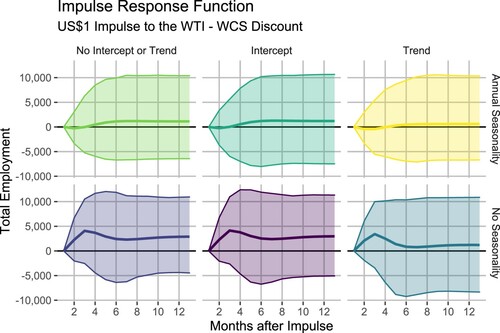
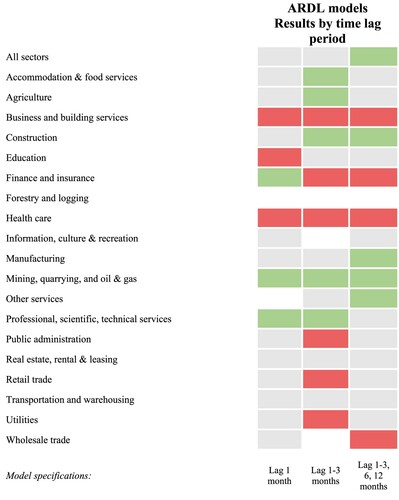
Figure 3. Sectoral results of ARDL regressions. Green indicates a positive effect; red indicates a negative effect; white indicates insignificant linear combinations (i.e. positive and negative lags cancelling out); and grey indicates that no term was retained by model selection.
Supplemental material