
Figures & data
Table 1. Definitions of variables.
Table 2. Descriptive statistics.
Figure 1. Time trend in carbon emissions and R&D expenditures a. The relationship between emissions intensity and R&D intensity in the full sample b. Comparison of the relationships between emissions intensity and R&D intensity for MNCs and domestic companies
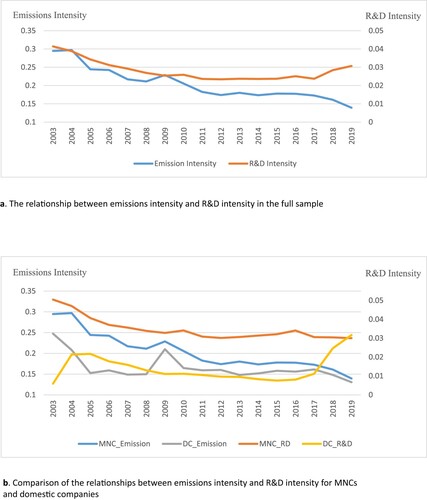
Table 3. Sample countries and mean values of selected variables.
Table 4. Pairwise correlations.
Table 5. The effect of R&D Intensity on Emissions Intensity.
Table 6. The role of FDI in explaining the effect of R&D Intensity on Emissions Intensity.
Table 7. Subperiod analysis for the role of FDI in explaining the effect of R&D Intensity on Emissions Intensity.