
Figures & data
Figure 1. SOEs’ R&D expenditures (Unit: USD millions with GDP deflator).
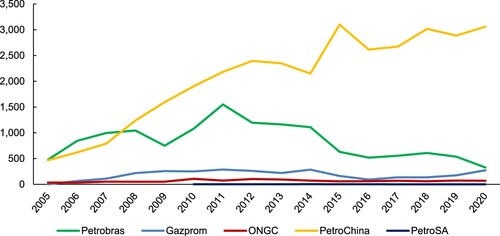
Figure 2. R&D intensity (%, R&D expenditures as a percentage of the company’s revenues) and the price of crude (in USD).
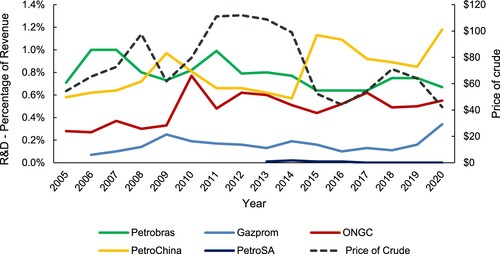
Figure 3. Share of green patents in total patent applications for Shell, Chevron, and BP.
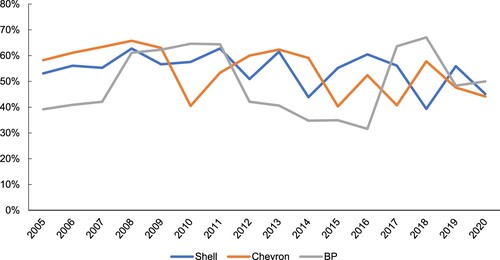
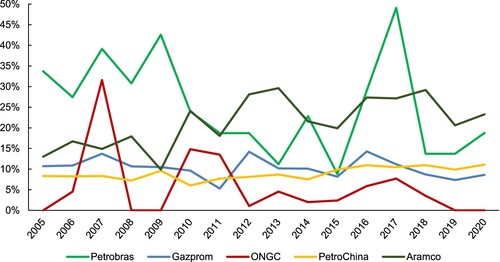
Figure 4. Proportion of green to total patent applications (%). Note: PetroSA is not included in the figure, because it only applied for green patents (2) in 2005, and its last patenting activity (in the non-green patents) was in 2012.
Supplemental material