Figures & data
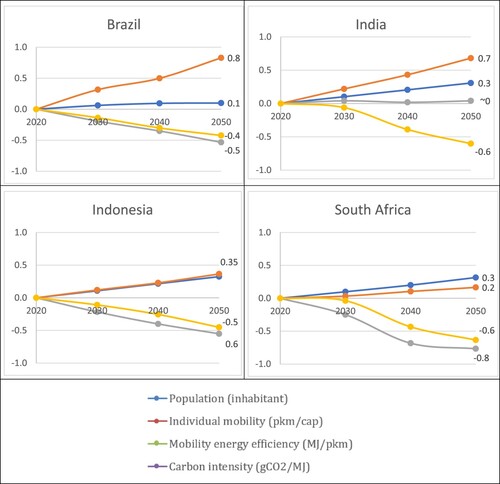
Figure 1. Passenger mobility projections in pkm per capita, 2020–2050.
Note: Metropolitan areas defined as: the eight largest metropolitan areas in Brazil: São Paulo, Rio de Janeiro, Brasília, Salvador, Fortaleza, Belo Horizonte, Recife, and Porto Alegre with more than 1.5 million inhabitants (16% of the population); the six largest in Indonesia: greater Jakarta, Bandung Raya, Surabaya, Medan, Semarang and Palembang with more than 1.5 million inhabitants (18% of the population). In India, metropolitan areas cover all cities having more than 1 million inhabitants, which includes 9 megacities with more than 6 million and 70 cities with more than 1 million inhabitants (30% of the population). The South African team has not been able to advance on such disaggregation between metropolitan versus non-metropolitan areas.
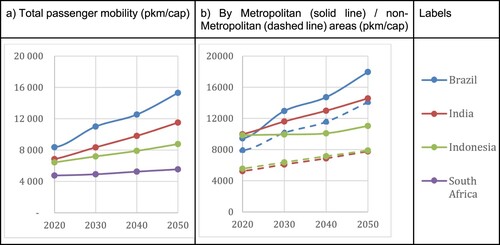
Figure 2. Share of pkm generated by constrained activities in Metropolitan (Solid line) / non-Metropolitan (Dashed line) areas, 2020–2050.
Note: ‘Constrained’ refers to a specific type of travel activity that is deemed essential. For example, this includes getting to a workplace or place of education, going home or buying food. ‘Non-constrained’ mostly refers to ‘leisure’ type of activity.
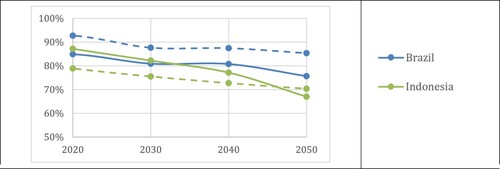
Figure 3. Share of private motorized mobility (car and motorized 2-wheelers) in total mobility (%Gpkm), 2020–2050.
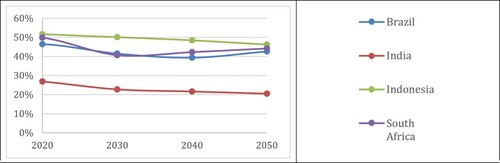
Figure 4. Share of private motorized mobility (car and 2-wheelers) for constrained and non-constrained trips in the two geographical areas, 2020–2050.
Note: In India, initial analyses have highlighted that the use of private mobility to fulfil constrained activities was more important in metropolitan than in non-metropolitan areas. This could be mostly explained by the fact that households in metropolitan areas have a better spending power and can afford a private vehicle.
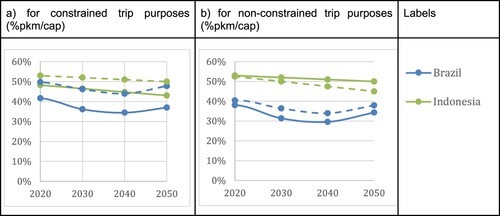
Figure 5. Share of passenger transport final energy consumption from non-fossil fuel sources (biofuels and electricity), %EJ, 2020–2050.
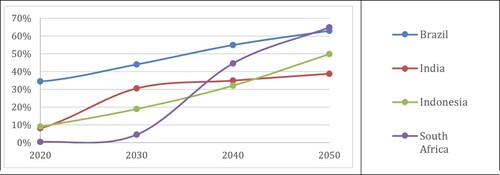
Figure 6. (a) Share of full-electric vehicles in total car stock, and (b) share of liquid biofuels and biogas in total liquid fuels and pipe gas consumed by passenger transport, 2020–2050.
Note: Plug-and-Hybrid Electric Cars do represent an important part of the car stock in Brazil and Indonesia by 2050, around one-third.
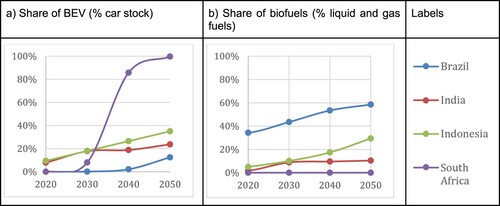
Figure A1. DDP Design framework for passenger transport (Lefevre et al., Citation2020).
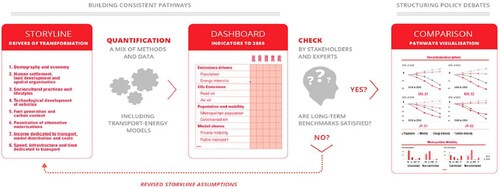
Table A1. Overview of the modelling and quantification architecture.
Figure A2. Per capita and per passenger kilometre CO2eq emissions from passenger transport.