
Figures & data
Figure 1. Data collection process of low-carbon urban experiment research using the PRISMA method.
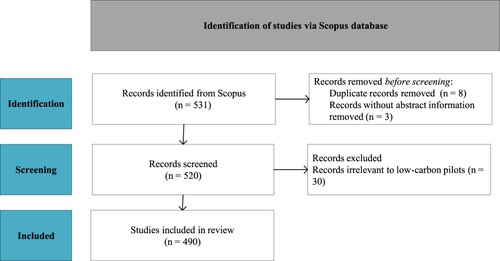
Figure 2. Number of articles related to low-carbon urban experiments from 2005 to 2020. (Academic attention on low-carbon urban experiments has increased greatly in the most recent decade.).
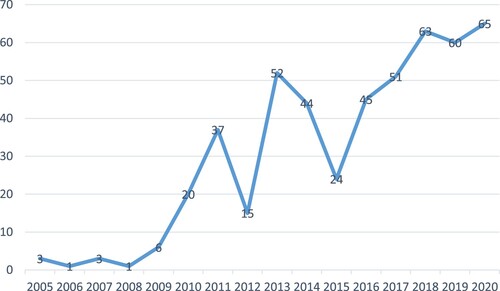
Figure 3. Review content of the low-carbon urban experiment research.
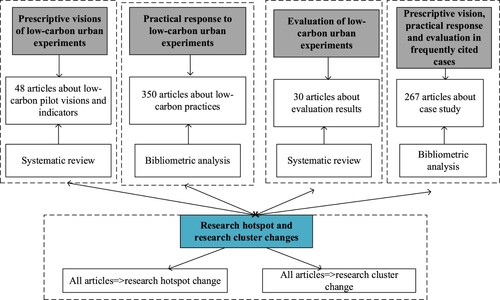
Figure 4. A timeline of low-carbon indicator development.
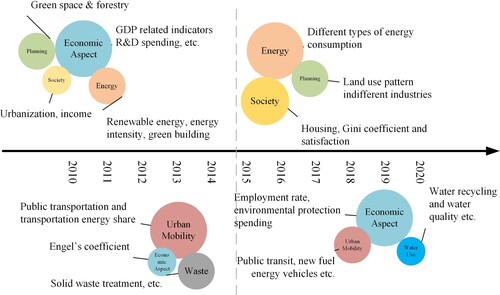
Figure 5. Categories of low-carbon urban experiment practices (a) from 2005 to 2015; (b) from 2005 to 2020 (top two practices in planning, energy and policy categories are shown).
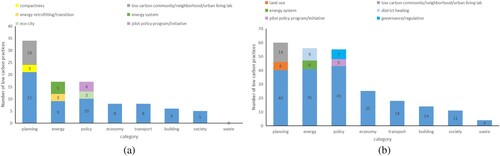
Table 1. Number of articles citing cities and aggregated article citation numbers.
Figure 6. Keyword timeline of low-carbon urban experiment research from 2005 to 2020.
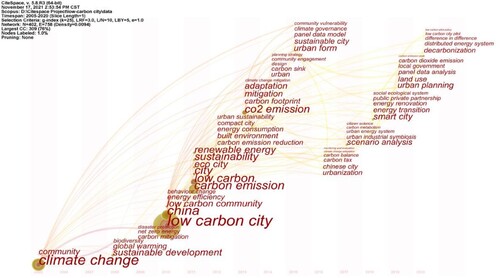
Figure 7. Research clusters of low-carbon urban experiment research from (a) 2005 to 2015 and (b) 2005 to 2020. (The colours in this figure mean different research clusters.).
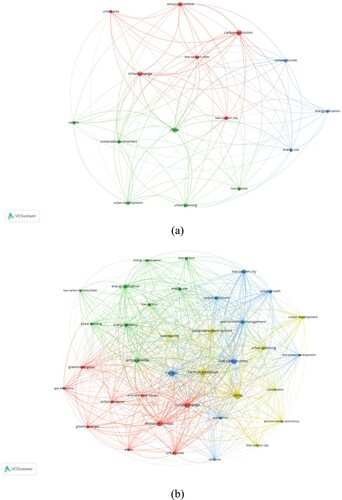
Figure 8. The relationships among prescriptive visions, practical responses and evaluation methods in low-carbon urban experiment research.
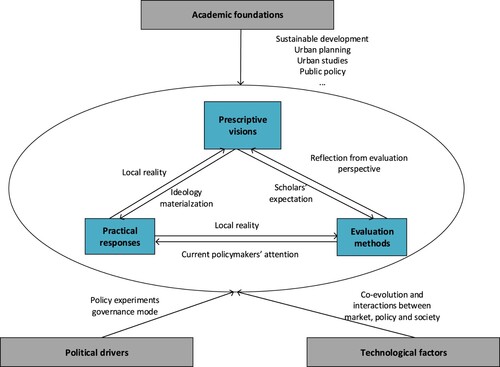
Table A1. Classification of low-carbon practices in each category.
Table A2. The major assessment aspects and corresponding indicators of low-carbon urban experiment development.