Figures & data
Table 1. Overview of indicators in the ambition and capability composite Indicators (Co-I).
Figure 1. Comparison of emission pathways in each target scenario, assuming constant emissions after the achievement of original net zero targets. ‘CCC BNZP’ refers to the Sixth Carbon Budget ‘Balanced Net Zero Pathway’ (n = 301).
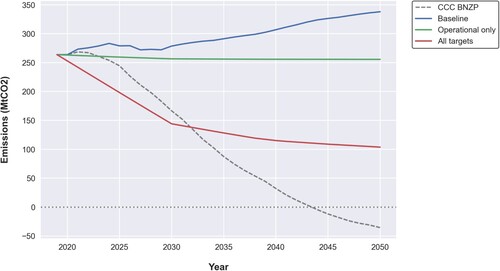
Figure 2. Comparison of emissions reduction pathways aggregated by LA type, and compared against the CCC BNZP scenario (sample: n = 311, in which unitary authorities: n = 54, metropolitan boroughs: n = 36, London boroughs: n = 33, district authorities: n = 178, and CAs: n = 10; indexed to 2019 = 1.0).
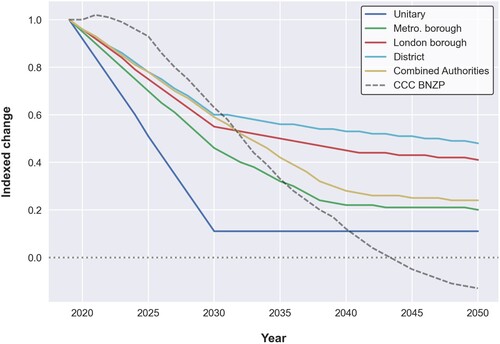
Figure 3. Comparison of emissions reduction pathways aggregated by region against the CCC BNZP pathway (n = 301; indexed to 2019 = 1.0).
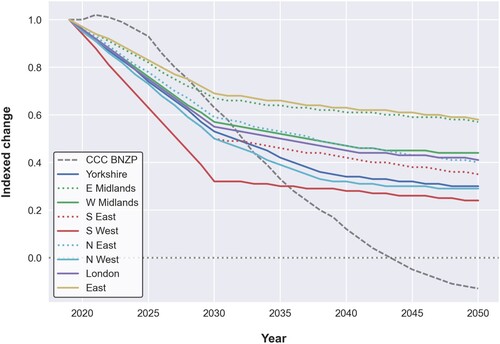
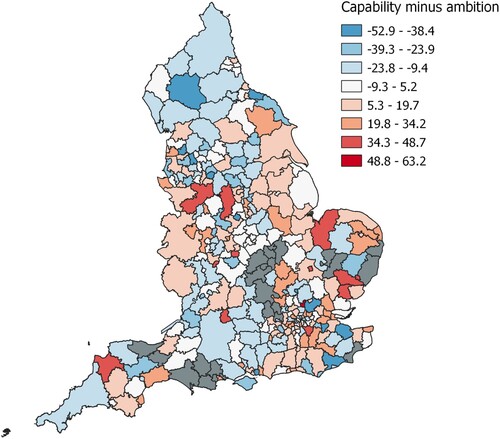
Figure 4. Choropleth indicating the difference between capability and ambition scores by LA (n = 301).