
Figures & data
Figure 1. Variable Importance in predicting acceptability of an ICEV phase-out (random forest model)
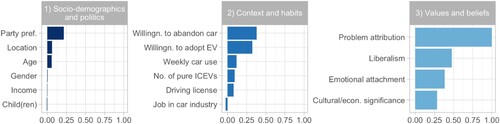
Figure 2. Average Marginal Effects (AME) of the ordered logit model. Note: Shown are the effects of each explanatory variable on the probability of each level of the outcome variable. The red dashed line marks the reference for each variable (see reference (R:) in right panel). Confidence intervals (95%) are displayed as whiskers. Explanation on political parties: SPD (social-democratic), CDU/CSU (conservative), Die Grünen (green), FDP (liberal), Die Linke (left), AfD (right-wing populist). The results are also printed in tabular form in Appendix A (table A3).
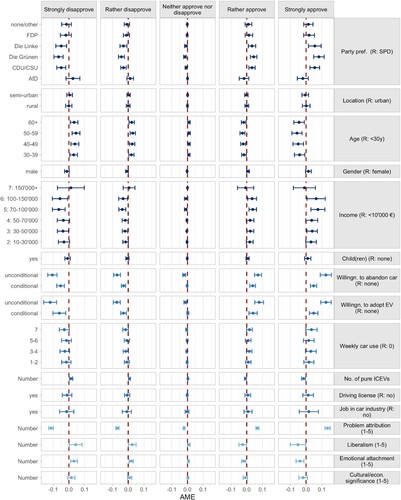
Figure 3. Outcome expectations (a.) and policy preferences (b.). Plot a. displays the percentage of respondents that anticipate negative, neutral, or positive effects of an ICEV phase-out on different entities. Plot b. shows respondents’ approval rates of several policies towards phasing out ICEVs. The difference of the four least approved policies are not statistically significant (tables A4 and A5).
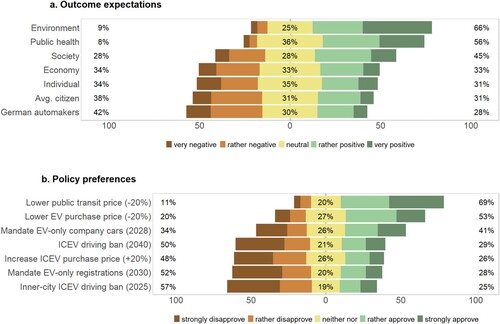
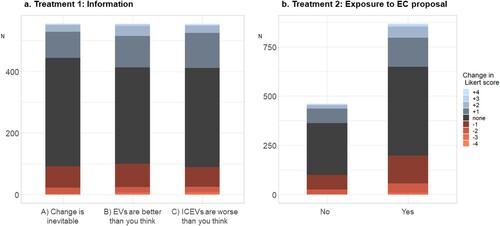
Figure 4. Information treatment effects. Plot a. displays changes in acceptability in response to new information, which followed one of three narratives (A-C). Plot b. shows changes in acceptability in response to the EC’s legislative proposal.
Supplemental Material
Download MS Word (808.8 KB)Data availability statement
The workflow code to reproduce our findings is publicly available on Zenodo (DOI:10.5281/zenodo.7915863).