
Figures & data
Figure 1. Conceptual framework, data source types, and component inputs metrics for the climate test decision metric to evaluate emissions significance of individual fossil fuel projects.
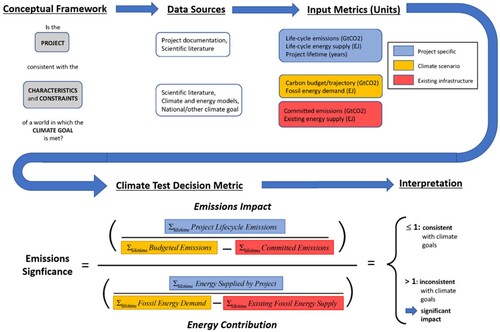
Table 1. Summary of data inputs (baseline and Monte Carlo analysis ranges) used for the climate test case study of a natural gas pipeline.
Figure 2. Graphical schematic of climate test components, labelled (A)–(G), and relationship to input parameters, labelled (i)–(x), that were varied during Monte Carlo and single factor sensitivity analyses. The graphs in the top row are all emissions-related, with units of GtCO2, and combine to create the emissions impact component (E), or the numerator of the emissions significance metric (G). Similarly, the graphs in the second row are all energy-related, with units of EJ, and combine to create the energy contribution component (F), or the denominator of the emissions significance metric (G). Across rows, from left to right, the graphs in the leftmost column are all characteristics of the project being evaluated, which are then used to compare the project to the characteristics of the climate goal, given existing energy system characteristics, found in the middle column. Together, simulated variations in the input parameter values drive variation in the emissions impact and energy contribution component results, and produce a distribution of emissions significance metric results, as shown in the far right graph. Each simulation result is judged against the same decision criteria of ≤1 for projects consistent with the climate goal and >1 for projects with a significant climate impact.
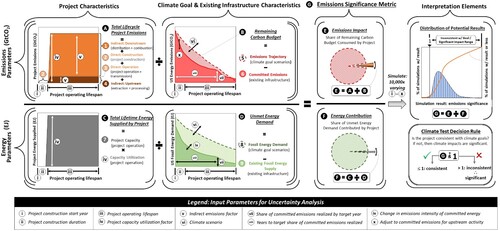
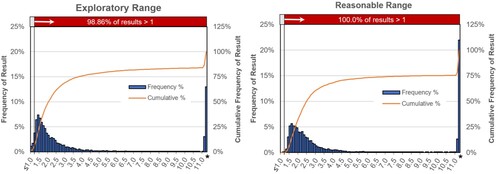
Figure 3. Frequency histogram for climate test emissions significance results from the Monte Carlo simulation using the wide exploratory range (left) and the narrower ‘reasonable’ range of the input variables (right).
Supplemental Material
Download MS Word (3.1 MB)Data availability statement
All data used to support this analysis, as well as a beta version of the climate test tool itself, are available on FigShare at: 10.6084/m9.figshare.19606225.