1,310
Views
0
CrossRef citations to date
0
Altmetric
Research Article

Nature to the rescue: past drivers and future potential of the Australian land-based carbon offsets market

ORCID Icon, ORCID Icon & ORCID Icon
Pages 601-616 | Received 13 Jun 2022, Accepted 23 Jun 2023, Published online: 02 Aug 2023

Figures & data

Table 1. Equation for linear regression of the landscape and market models.

Figure 1. Agricultural Profit at Full Equity (Marinoni & Navarro Garcia, Citation2018) versus Maximum Biomass Layer (Roxburgh et al., Citation2019) for the Australian landscape and approved abatement projects, segmented by project method. Loge scale on both axes.

Figure 1. Agricultural Profit at Full Equity (Marinoni & Navarro Garcia, Citation2018) versus Maximum Biomass Layer (Roxburgh et al., Citation2019) for the Australian landscape and approved abatement projects, segmented by project method. Loge scale on both axes.

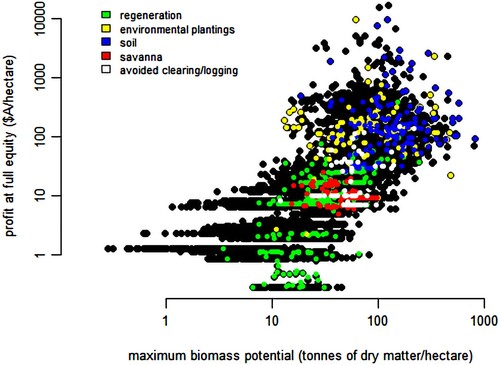
Table 2. linear regression model of the association between farm profits (PFE) and site biomass potential (M) for the Australian landscape and approved abatement projects.

Figure 2. Map of approved abatement projects and the biomass/agricultural profit layer (M/PFE) ratio for Australia.

Figure 2. Map of approved abatement projects and the biomass/agricultural profit layer (M/PFE) ratio for Australia.

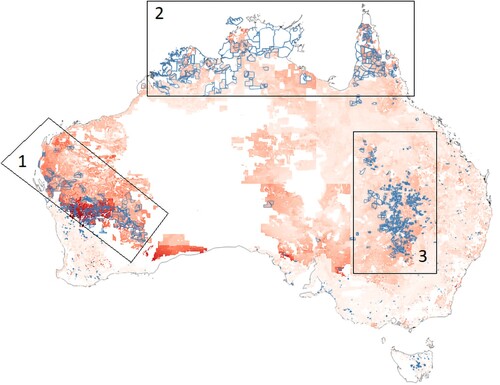
Table 3. Highlighted offset project groups, with description.

Supplemental material

Supplemental Material

Download MS Word (339.7 KB)