
Figures & data
Figure 1. An illustration of the main factors hypothesized in this study that may relate to the adoption of VCOs in universities. This includes universities’ characteristics, carbon management practices adopted and carbon emissions.
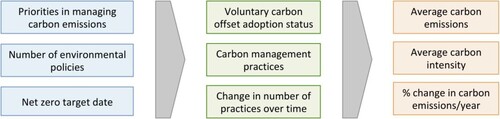
Figure 2. Cumulative number of universities who adopted voluntary carbon offsets over time, with exponential regression line shown (linear regression, y = 1.3926x − 2794.5, R2 = 0.84331) (n = 28).
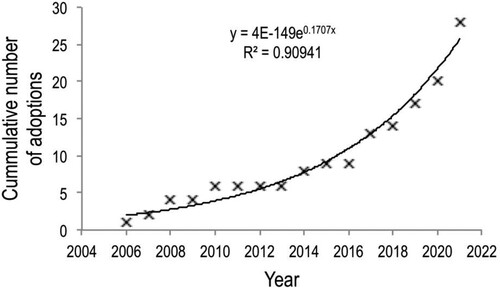
Figure 3. Selection of attributes of adopters (light shading) and non-adopters (dark shading) of voluntary carbon offsets. Only four of eleven attributes tested using Welch tests (see below) show significant differences between adopters and non-adopters at the 95% level (*). (a) shows the mean frequency results for each attribute and 3(b) shows mean scope 1 and 2 carbon emissions in metric tonnes of CO2-equivalent (MT CO2) and mean carbon Intensity (MTCO2/full-time equivalent student), and how these change over time.
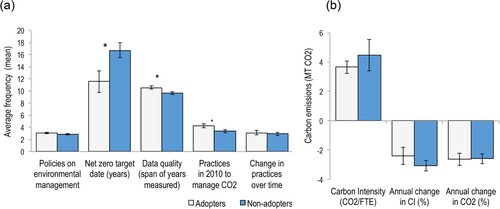
Table 1. Characteristics, practices and outcomes of adopters (n = 34) and non-adopters (n = 62) of voluntary carbon offsets for attributes encompassing respondents’ (a) characteristics and practices to mitigate carbon emissions, and (b) outcomes in terms of carbon emissions.
Table 2. Practices to manage carbon emissions and climate change undertaken by adopters and non-adopters of VCO in 2010 and 2020 (%) classified into three carbon emission groups: A, those affecting scope 1&2 emissions which are counted in location-based accounting; B, those affecting scope 1&2 emissions but are not counted in location-based accounting; and C, those affecting scope 3 emissions and are not counted (n/a indicates carbon management strategies which cannot be accounted for with current data).
Figure 4. Mean annual carbon emissions and carbon intensity from 2009 to 2019 for adopters (n = 34) and non-adopters (n = 62) of voluntary carbon offsets. (a) illustrates carbon emissions in metric tonnes (MT) of gross scope 1 and 2 CO2-equivalent (CO2), which adopters reduced significantly over time (Spearman’s Rho, −0.745, p = .008) while non-adopters did not (Spearman’s Rho, −0.591, p = .056). (b) carbon intensity (CI) illustrates MTCO2 per full-time equivalent student (FTE). Both adopters and non-adopters reduced carbon intensity significantly over time (Spearman’s Rho, −0.797, p = .002 and −0.645, p = .032, respectively).
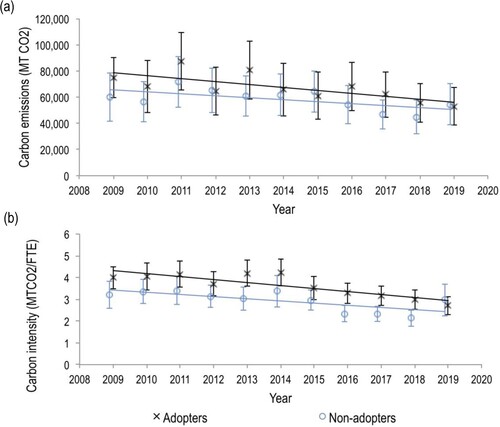
Figure 5. Correlations between attributes of the universities sampled and their carbon emissions for all survey respondents (n = 96) to illustrate a selection of significant Spearman’s Rho correlations (), including between (a) number of environmental policies held by universities (not including a policy to offset carbon emissions) and number of practical actions taken in 2020 (p = <.001); (b) net zero target date and % change in CO2/year (p = .024); (c) number of policies in 2020 and mean carbon intensity (p = .001); and (d) changes in the number of practical actions and % change in carbon intensity/year (p = .010).
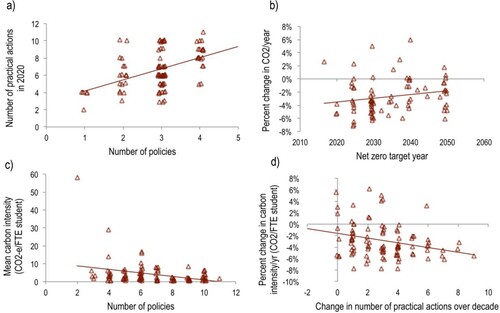
Table 3. Correlations between different attributes of both adopters and non-adopter respondents combined (n = 96) indicating that the number of policies and practices are correlated significantly with each other and with carbon emissions outcomes using Spearman’s Rho correlation in SPSS (2-tailed).