Figures & data
Figure 1. Distribution of EU-27 countries based on the two variables used in the cluster analysis: total projected emission without LULUCF in 2030 and the projections of LULUCF net emissions in 2030 (EEA, Citation2021). The figure shows how many countries’ projections envisage the LULUCF as a net source of emissions (above the zero on the vertical axis) and as a net sink (below the zero on the vertical axis). Cluster 2 is split into two sub-clusters to highlight an important difference: both sub-clusters include countries with relatively low total emissions without LULUCF, but, while for cluster 2b LULUCF is always a net sink, cluster 2a includes countries with positive net emissions from LULUCF.
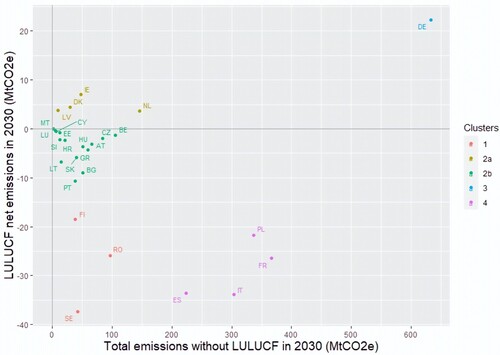
Table 1. Land-based Policies and Measures (PaMs) for climate change mitigation and adaptation found in the Long-Term Strategies, categorized following the activity grouping of the IPCC (legend below the table). Only PaMs reported at least by four countries are shown here: the complete list with all PaMs for all countries is included in the supplementary materials (Annex 2).
Table 2. Characteristics of each cluster and the respective net GHG emissions (+) and removals (−).
Figure 2. Distribution of the EU-27 net LULUCF CO2e removal pathways according to different sources. The revised LULUF reg. target and the countries’ projections present the largest and the lowest removal value, respectively, in 2030 and the Reference Scenario is placed in between them.
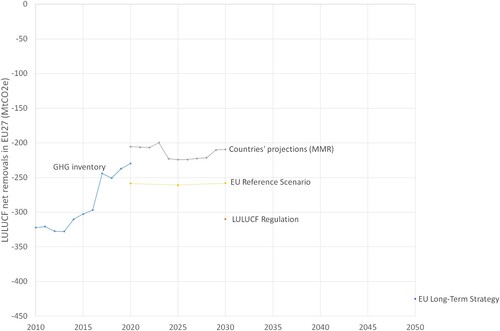
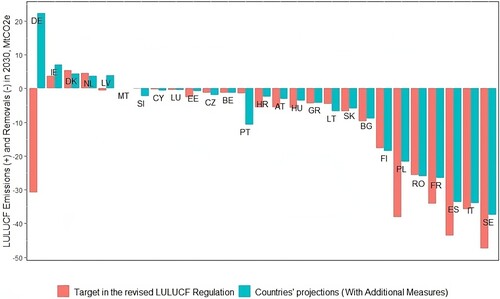
Figure 3. Comparison between the 2030 LULUCF emission/removal projections ‘With Additional Measures’ (submitted by EU countries under the Regulation (EU) 2018/1999), and the 2030 target calculated in the revised EU LULUCF reg. 2018/841; 15 out of 27 projections will not meet the European Commission target.