Figures & data
Figure 1. Panel a: Elements characterizing a carbon emissions pathway. Net CO2 emissions (opaque grey area) equal gross emissions (all grey areas) minus gross removals (all blue areas). Net emissions coincide with gross emissions in the near future until carbon dioxide removal (CDR) is ramped up. When gross emissions equal gross removals, net zero CO2 emissions are achieved (vertical dashed line). Beyond net zero, gross removals exceed gross emissions, resulting in net negative emissions or net carbon removals (opaque blue area). Net emissions deplete the remaining cumulative (RC) carbon budget, whereas net removals replenish an overshot RC carbon budget. Gross emissions which remain hard-to-abate in the long-term are labelled residual emissions. ‘CDR’ is a general term which comprises gross removals and net negative emissions, or the underlying technologies and practices, depending on the context. Panel b: Elements characterizing the CRO framework. Carbon debt is generated by gross emissions once the RC carbon budget has been depleted, here around 2030. Carbon debt is compensated intertemporally by gross removals. Panel c: The repayment term structure shows the time to maturity in years as a function of the date of issuance for the profile in panel b. For an analytical definition see Bednar et al. (Citation2023).
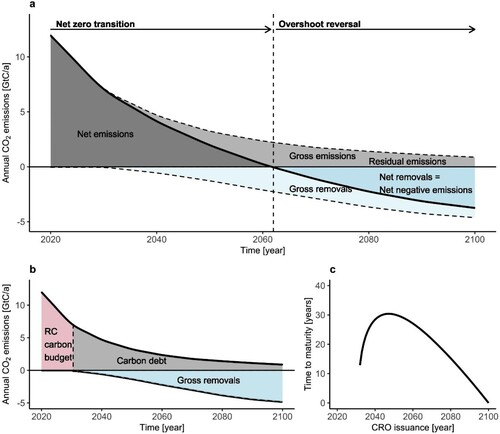
Figure 2. At the time of emission, an Issuer issues a CRO to the emitter, held until maturity. By maturity, emitters must own a removal unit (RU), generated by CDR projects and traded on a CDR market or directly generated by certified in-house operations of the emitter. The CRO is cancelled against an RU at maturity. Between issuance and maturity, emitters pay a Premium, serving to (1) reduce emitter-specific (idiosyncratic) risks, (2) guide the emissions and removals paths and (3) potentially allocate revenues towards mitigating future loss & damage or adaptation needs related to temporary atmospheric CO2 stocks. In the figure, dashed boxes indicate actions or events; green arrows denote financial flows; blue arrows represent the exchange of CROs and RUs; and orange arrows depict physical CO2 fluxes.
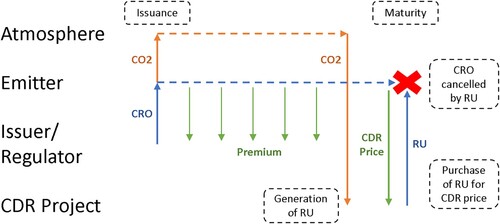
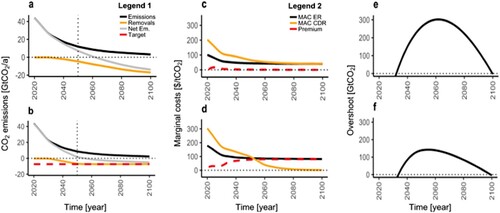
Figure 3. Climate mitigation scenarios based on a 1.5°C RC carbon budget (400GtCO2 from 2020 onwards). For the full range of scenarios see Bednar et al. (Citation2023). The left column (a, c, e) reflects a standard mitigation scenario, whereas the right column (b, d, f) illustrates a scenario where gross removals were capped at 2 GtC/a, similar to the scenario archetypes in Obersteiner et al. (Citation2018). Panels a & b: Emission profiles, including gross emissions (black), gross removals (orange) and net emissions/removals (grey). In panel b gross removals were capped at 2 GtC/a (red dashed line). Panels c & d: Present value marginal cost paths of emission reductions (ERs, black) and carbon dioxide removal (CDR, orange); as well as the present value CRO Base Premium (red dashed line). The CRO Base Premium is defined as the present value of marginal costs of ERs at issuance of the CRO minus the present value CDR price at maturity. Capping gross removals implies a larger CRO Premium in panel d than in panel c. Panels e & f: Cumulative CO2 emissions above the RC carbon budget. The upper bound for gross removals reduces the overshoot of the RC carbon budget and associated risks.