
Figures & data
Figure 1. Illustration of the difference between weak carbon neutrality (upper graph) and a company on the path to net zero in 2050 (lower graph) in which emissions are reduced to a residual level and offset exclusively with carbon removal credits, adapted and modified from (SBTi, Citation2021).
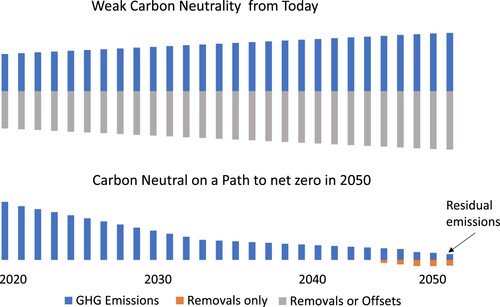
Figure 2. Steps to analyze companies’ climate pledges with a focus on defining residual emissions.
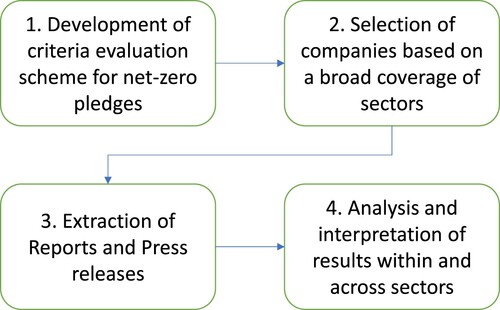
Figure 3. The climate pledges of the different companies, if the companies committed to only using removals, mentioned residual emissions or not and if their climate pledge covered scope 3 emissions (from left to right).
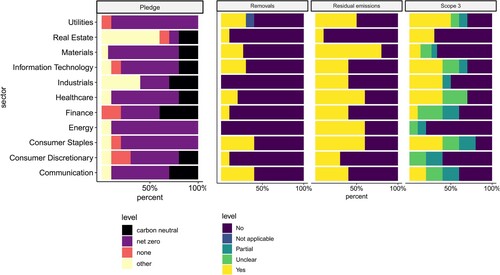
Figure 4. Classifying companies with net zero and carbon neutrality pledges according to their mentioning of residual emissions and commitment to only using removals. Pledges that include absolute scope 3 emissions are underlined and bold.
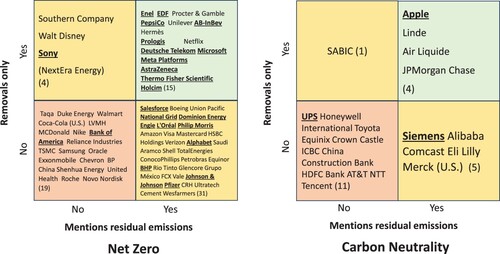
Figure 5. Reported residual emissions of the different companies, the dashed line is equal to the mean and the recommended level by the SBTi for its cross-sector pathway.
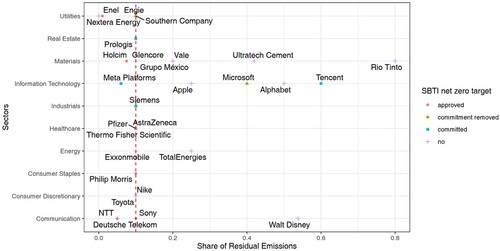
Table 1. Overview of companies that define residual emissions or link them to a certain process.