Figures & data
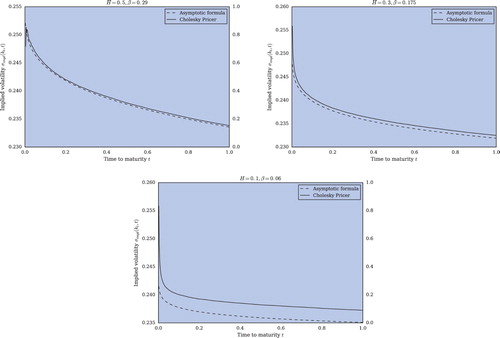
Figure 1. Illustration of the term structure of implied volatility of the Modified Rough Bergomi model in the Moderate deviations regime with time-varying log-strike . Depicted are the asymptotic formula (equation (Equation17
(17)
(17) ), dashed line) and an estimate based on
samples of a MC Cholesky Option Pricer (solid line) with 500 time steps. Model parameters are given by spot vol
, vvol
and correlation parameter
.