Figures & data
Figure 1. The S&P 500 index and the mean absolute signal correlations.
Notes: sample period: 1996.06–2020.08; The figure shows the relation between the S&P 500 Index and the mean absolute signal correlations between a collection of market-based and fundamental indicators. is a correlation matrix that contains the cross-correlations between the signals. The mean of the absolute cross-correlations of the signals (the absolute of the elements of
) indicates the strength of the correlations. See Section 3.2 for more detail about the signals (predictors).
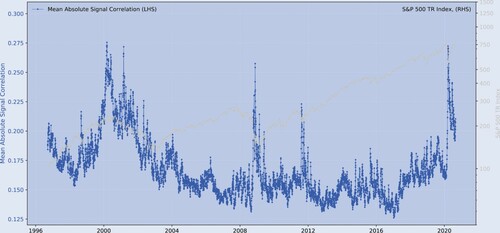
Table 1. Predicted vs. realized returns (main result, out-of-sample).
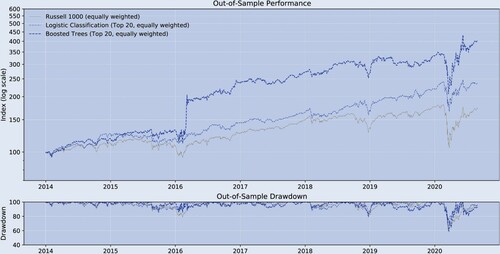
Figure 2. Historical performance (main result, out-of-sample).
Notes: bi-weekly forecast horizon and rebalancing; in-sample period: 1995.12–2013.12; out-of-sample period: 2013.12–2020.08; Stock Sample: Russell 1000. This figure compares the performance of the different trading strategies.
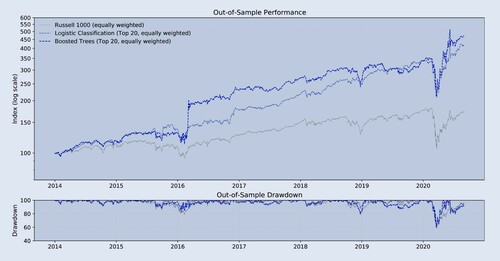
Table 2. Performance indicators (main result, out-of-sample).
Figure 3. Monte-Carlo correlations: varying , normal distribution.
Notes: bi-weekly forecast horizon and rebalancing; in-sample period: 1995.12–2013.12; out-of-sample period: 2013.12–2020.08; Stock Sample: Russell 1000. Panel A shows the distribution of the empirical predictor correlations . Panel B shows the distribution of the simulated
's. Panel C shows the distribution of the simulated predictor correlations
that yielded the lowest
. Panel D shows the distribution of the simulated predictor correlations
that yielded the highest
.
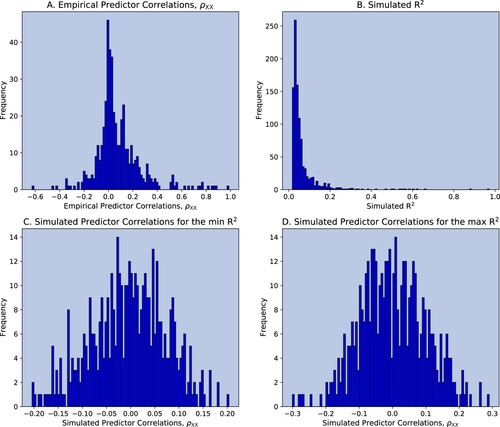
Figure 4. Monte-Carlo correlations: varying , bimodal distribution.
Notes: bi-weekly forecast horizon and rebalancing; in-sample period: 1995.12–2013.12; out-of-sample period: 2013.12–2020.08; Stock Sample: Russell 1000. Panel A shows the distribution of the empirical predictor correlations . Panel B shows the distribution of the simulated
's. Panel C shows the distribution of the simulated predictor correlations
that yielded the lowest
. Panel D shows the distribution of the simulated predictor correlations
that yielded the highest
.
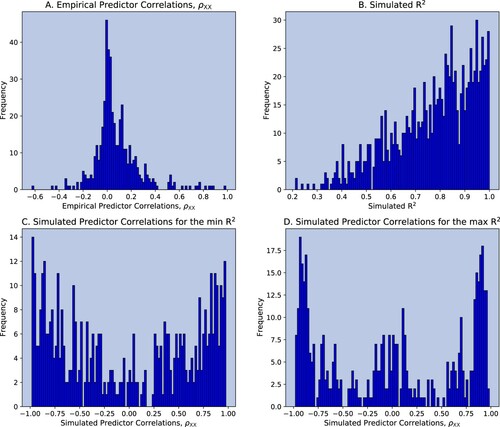
Table 3. Implied market volatility and signal correlations ( ).
).
Figure A1. Historical performance (Robustness test A, out-of-sample).
Notes: bi-weekly forecast horizon and rebalancing; in-sample period: 1995.12–2013.12; out-of-sample period: 2013.12–2020.08; Stock Sample: Russell 1000. This figure compares the performance of the different trading strategies.
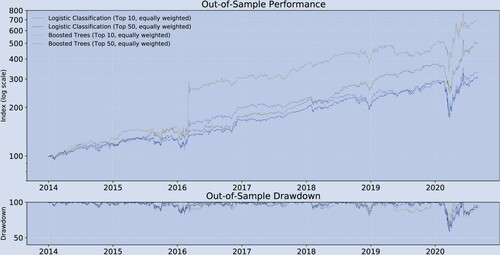
Table B1. Performance indicators (Robustness test A, out-of-sample).
Figure A2. Historical performance (robustness test B, out-of-sample).
Notes: bi-weekly forecast horizon and rebalancing; in-sample period: 1995.12–2016.12; out-of-sample period: 2016.12–2020.08; Stock Sample: Russell 1000. This figure compares the performance of the different trading strategies.
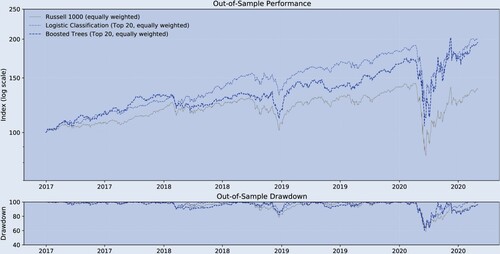
Table C1. Predicted vs. realized returns (robustness test B, out-of-sample).
Table C2. Performance indicators (robustness test B, out-of-sample).
Figure A3. Historical performance (robustness test C, out-of-sample, monthly).
Notes: monthly forecast horizon and rebalancing; in-sample period: 1995.12–2013.12; out-of-sample period: 2013.12–2020.08; Stock Sample: Russell 1000. This figure compares the performance of the different trading strategies.
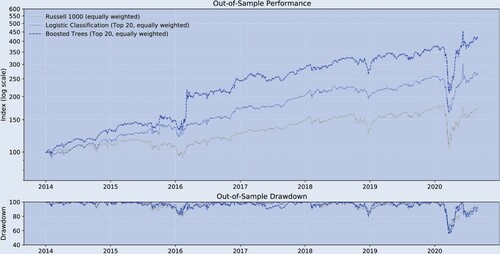
Figure A4. Performance indicators (robustness test C, out-of-sample, weekly).
Notes: weekly forecast horizon and rebalancing; in-sample period: 1995.12–2013.12; out-of-sample period: 2013.12–2020.08; Stock Sample: Russell 1000. This table shows a variety of performance measures for different trading strategies.
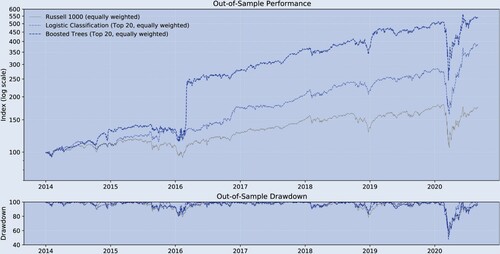
Table D1. Predicted vs. realized returns (robustness test C, out-of-sample, monthly.
Table D2. Predicted vs. realized returns (robustness test C, out-of-sample, weekly).
Table D3. Historical performance (robustness test C, out-of-sample, monthly).
Table D4. Performance indicators (robustness test C, out-of-sample, weekly).
Figure A5. Historical performance (robustness test D, out-of-sample).
Notes: bi-weekly forecast horizon and rebalancing; in-sample period: 1995.12–2013.12; out-of-sample period: 2013.12–2020.08; Stock Sample: Russell 1000. This figure compares the performance of the different trading strategies.
Figure A6. Performance indicators (robustness test D, out-of-sample).
Notes: bi-weekly forecast horizon and rebalancing; in-sample period: 1995.12–2013.12; out-of-sample period: 2013.12–2020.08; Stock Sample: Russell 1000. This table shows a variety of performance measures for different trading strategies.
Table E1. Predicted vs. realized returns (robustness test D, out-of-sample).
Figure A7. Historical performance (robustness test E, out-of-sample).
Notes: bi-weekly forecast horizon and rebalancing; in-sample period: 1995.12–2013.12; out-of-sample period: 2013.12–2020.08; Stock Sample: Russell 1000. This figure compares the performance of the different trading strategies.