
Figures & data
Figure 1. QuantNet workflow: from market data to decoding/signal generation.
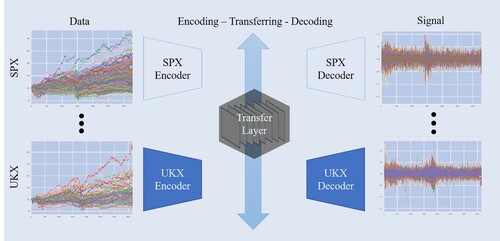
Figure 2. World map depicting the different clusters formed from the scores of QuantNet encoder. For visualization purposes, we have picked the market with the biggest market capitalization to represent the country in the cluster.
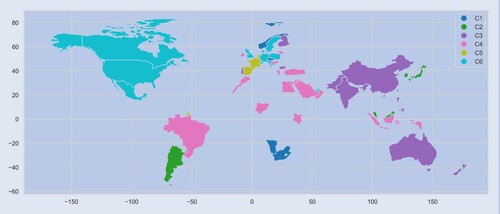
Figure 3. Histogram of Sharpe ratio contrasting QuantNet with baseline strategies.
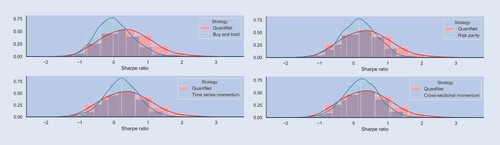
Table 1. Median and mean absolute deviation (in brackets) performance on 3103 stocks across all markets analysed.
Figure 4. Average Sharpe ratios of QuantNet and No Transfer across 58 equity markets.
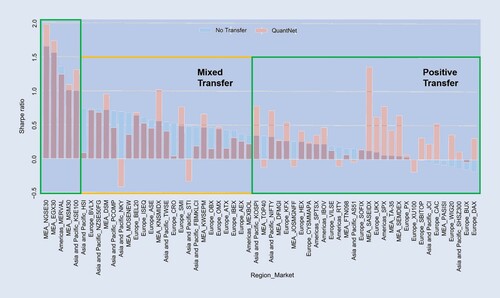
Figure 5. (a) Average cumulative returns (%) of SPX Index, UKX Index, KOSPI Index and SASEIDX Index contrasting QuantNet and No Transfer. Average Sharpe ratio difference between QuantNet versus No Transfer, aggregated by sample size (b) and number of assets per market (c)—in both we have subtracted QuantNet SR from No Transfer SR to reduce cross-asset variance and baseline effect.
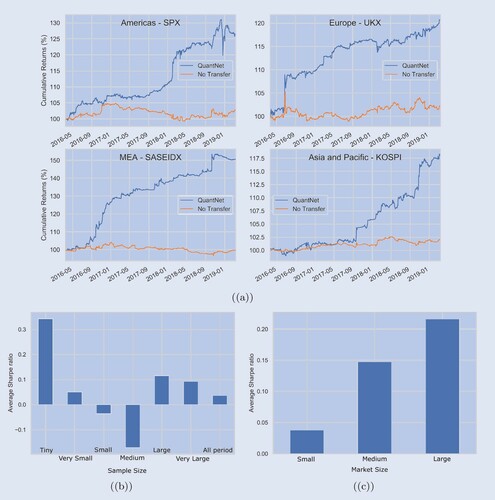
Table A1. Markets used during our experiment.
Table B1. No Transfer and QuantNet hyperparameters and configurations investigated.
Figure A1. Taxonomy of transfer learning sub-paradigms.
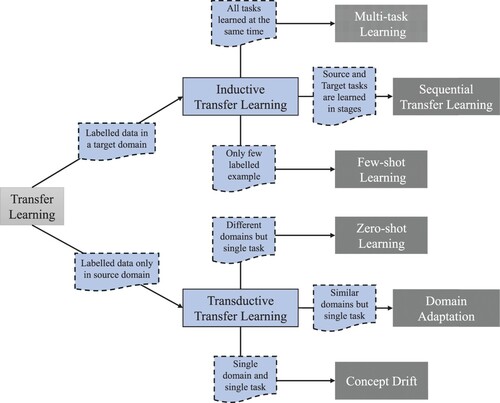
Table D1. Approaches and applications of transfer learning across finance and general domains.
Figure A2. Average Sharpe (a) and Calmar (b) ratios of QuantNet and No Transfer across 58 markets.
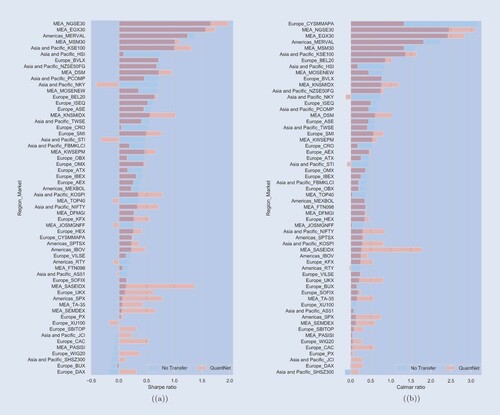
Figure A3. World map of average relative (%) Sharpe ratio difference between QuantNet versus No Transfer. For visualisation purposes, we have averaged the metric for the USA, China, and Israel/Palestine.
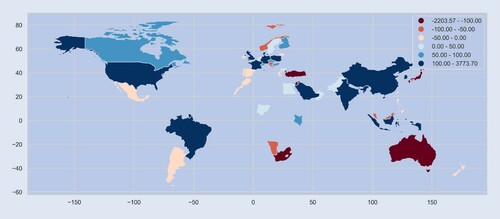
Figure A4. Scatterplot of QuantNet and No Transfer average Sharpe (a) and Calmar (b) ratios of each market overlaid by a linear regression curve.
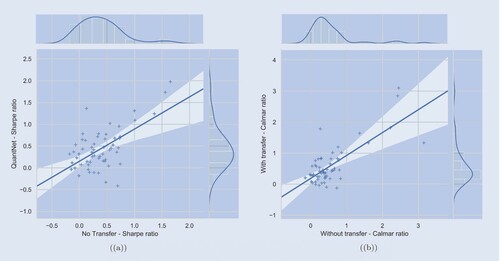
Table E1. Financial metrics of QuantNet and No Transfer strategies in SPX Index, UKX Index, KOSPI Index, and SASEIDX Index.
Figure A5. Average cumulative returns (%) of SPX Index, UKX Index, KOSPI Index and SASEIDX Index contrasting QuantNet and No Transfer strategies. Before aggregation, each underlying asset was volatility-weighted to 10%.
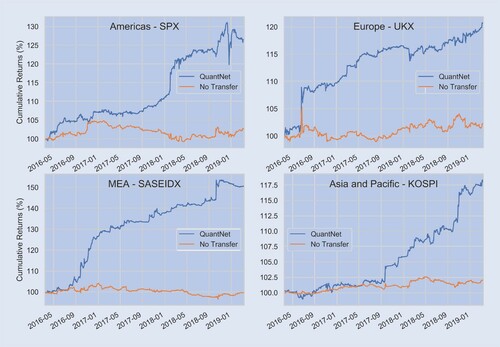
Figure A6. Histogram of Sharpe ratio of SPX Index, UKX Index, KOSPI Index, and SASEIDX Index contrasting QuantNet and No Transfer strategies.
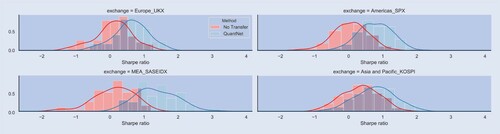
Figure A7. Scatterplot of Sharpe ratio of SPX Index, UKX Index, KOSPI Index, and SASEIDX Index contrasting QuantNet and No Transfer strategies.
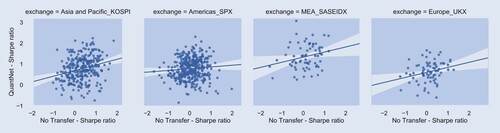
Table F1. Models coefficients and t-stats for the different markets and factors.
Figure A8. Dendrogram of hierarchical clustering using the scores from QuantNet encoder layer.
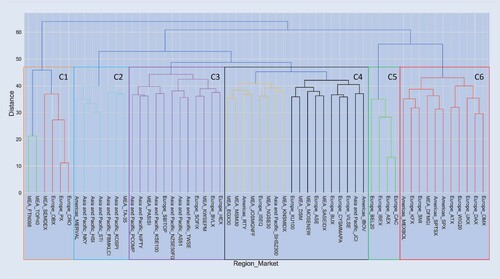
Table H1. Average Sharpe ratio per different dimensions and configurations of QuantNet and No Transfer strategies.