
Figures & data
Figure 1. Left panel: objective functions (no randomization),
(optimal randomization), and
(‘naive’ randomization); right panel: relative deviations of
(without randomization),
(optimal randomization),
(‘naive’ randomization)
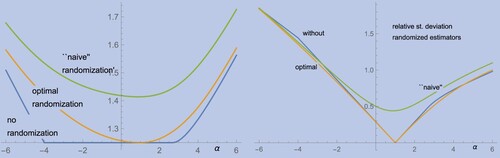
Figure 2. Cash-flow Z1 versus continuation value C1 as a function of W1 for (Pa1) (left) and (Pa2) (right).
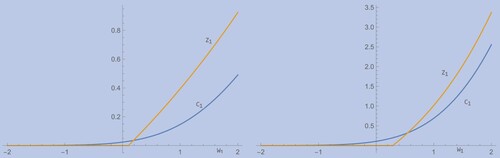
Figure 3. Objective function for BS-Call (Pa1) without randomization as function of .
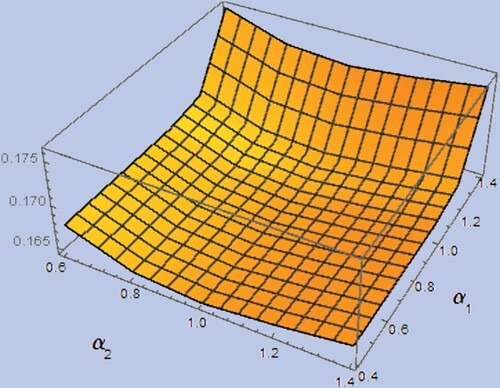
Figure 4. Objective function for BS-Call (Pa1) with optimal randomization as function of .
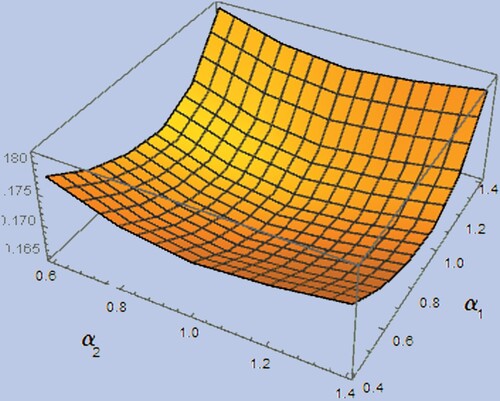
Figure 5. Left panel: objective functions of with
fixed, for BS-Call (Pa1) without, optimal, and ‘naive’ randomization; right panel: relative deviation of
(i.e. without randomization).
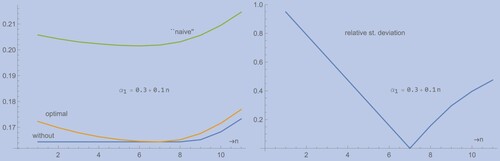
Table 1. LP minimization results due to and
for (Pa1).
Table 2. LP minimization results due to and
for (Pa2).