Figures & data
Figure 1. Examples of rates curves over different days from the OptionMetrics rates data.
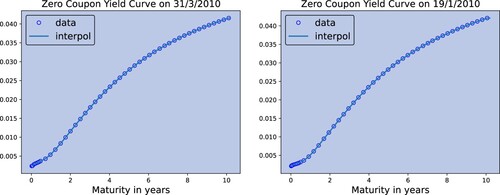
Figure 2. Top: Time series of the OptionMetrics rates for different maturities. Bottom: Estimation of the Hurst exponent for the OptionMetrics rates data.
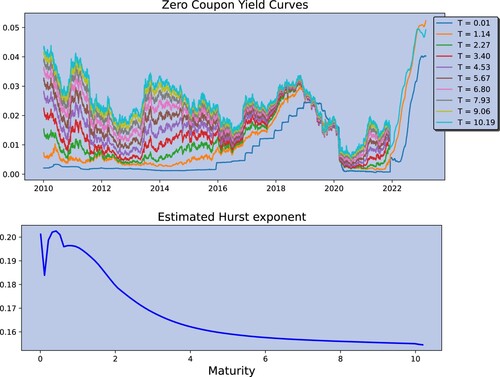
Figure 3. Top: Time series of the US Treasury rates for different maturities. Bottom: Estimation of the Hurst exponent for the US Treasury rates.
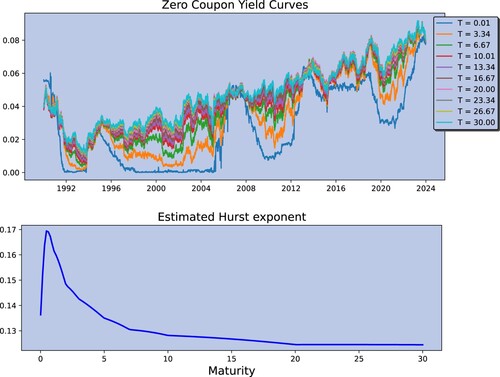
Table 1. aaaa
Figure 4. Dynamics of the zero-coupon bond in the Exponential (left) and the Riemann-Liouville (right) kernel case.
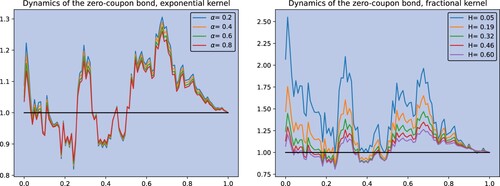
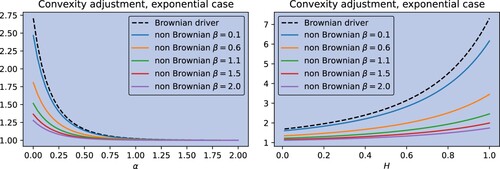
Figure 5. Left: Impact of the exponential factor α on the convexity for the Exponential kernel from section 2.3.1. Right: Impact of the Hurst exponent H on the convexity for the power-law kernel from section 2.3.2.
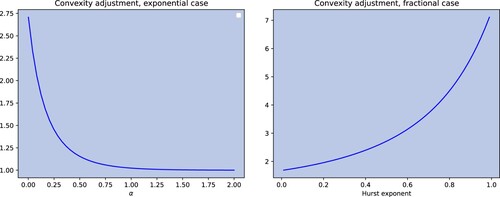
Figure 6. Left: Impact of the exponential factor α on the convexity for the Exponential kernel with standard Brownian motion (black dashed) and with OU driver with different β parameters. Right: Same but with the power-law kernel.