
Figures & data
Table 1. Definition of variables of the theoretical model.
Table 2. Sensitivity analysis with respect to mean reversion speed (q).
Table 3. Sensitivity analysis with respect to long-term profitability (θ).
Table 4. Sensitivity analysis with respect to current profitability level (x).
Figure 1. The theoretical cross sectional relationship between leverage and return on asset.
Note: The figure uses numerical sensitivity results from the theoretical model in Table 4. The y-axis is Levb and the x-axis is a theoretical measure of return on assets taken as which defines the after tax earnings divided by the value of unlevered assets Ub(x).
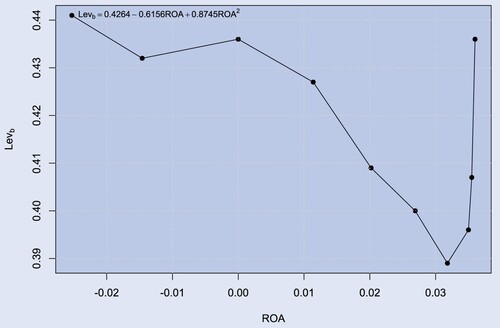
Table 5. Sensitivity analysis with respect to earnings volatility (σ).
Table 6. Summary of directional effects on firm value, firm investment and default policies and leverage dynamics.
Table 7. Sample of mean reverting and non-stationary firms.
Figure 2. Example of a firm classified as mean reverting.
Notes: The figure shows an example of mean reverting firm with gvkey = 1609 with estimated parameters θ = 1.5, q = 0.23 and σe = 0.37. The figure show earnings (oibdpq) unadjusted for seasonality and scaled by the initial value of earnings of the firm for the whole periods of consecutive available data the firm.
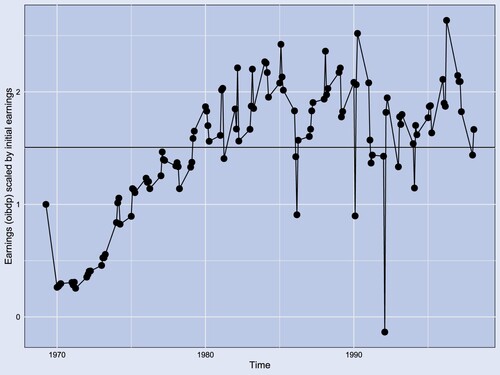
Table 8. Descriptive statistics for sample of mean reverting and non-stationary firms.
Table 9. Factors affecting leverage for mean reverting firms.