Figures & data
Figure 1. The bedmap2 bed topography of Antarctica (Fretwell et al., Citation2013) rebounded after the removal of present ice load (Jamieson et al., Citation2014). The white line indicates the coastline under these rebounded conditions.
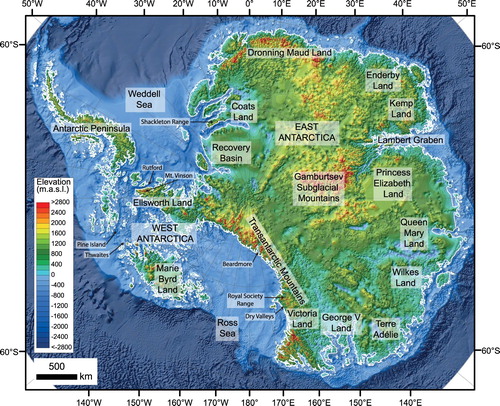
Figure 2. Plate configuration of Gondwana at the early stages of breakup about 120 million years ago. After Lawver, Gahagan, and Coffin (Citation1992).
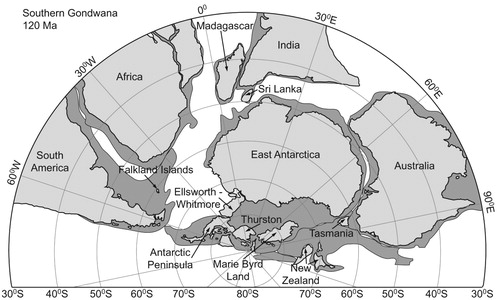
Figure 3. The greenhouse-icehouse transition in Antarctica. The oxygen isotope curve (black) is a measure of world temperature combining ice volumes and ocean temperatures and comes from analysis of deep-sea sediments (Miller, Wright, & Browning, Citation2005). The ice extents for different stages (shaded black) come from ice sheet modelling (Jamieson et al., Citation2010). The Oligocene to middle Miocene saw ∼ 33 glacial cycles with meltwater abundant, probably similar to conditions in present-day Greenland. Subsequent Miocene cooling saw the Antarctic Ice Sheet advance to the edge of the continental edge, perhaps on several occasions.
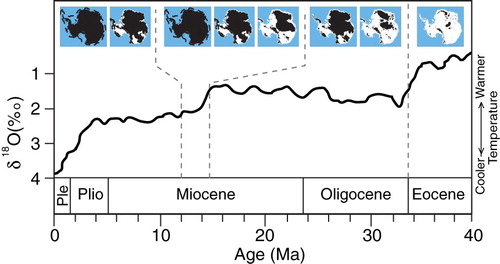
Figure 4. Denudation associated with passive margin evolution in Namibia, southern Africa (from Cockburn et al., Citation2000). (A) Post-break-up (130 Ma) to the end of the Eocene (36 Ma). (B) Post-Eocene. (C) Variations in mean denudation rates (solid coloured lines) and the standard deviation (dashed coloured lines) across the margin for each of the two periods. Mean (solid black line) and maximum and minimum (dashed black lines) topography of the region is from GTOPO30 digital elevation data. Denudation rates (symbols) modelled for the cosmogenic isotope data are the mean values of paired 10Be and 26Al measurements.
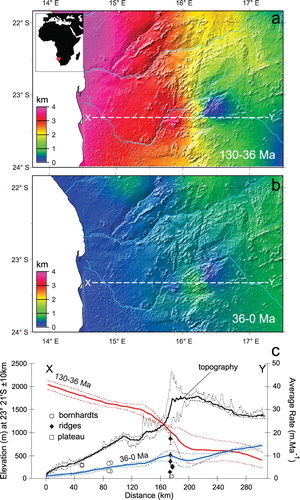
Figure 5. Examples of weathered landscapes as a result of warm, humid climate similar to Antarctica during the Eocene. (A and B) Corestones set in soft, deeply weathered regolith near Antananarivo, Madagascar. (C) As regolith is removed, corestones begin to armour the landscape, south central Madagascar. (D) A bornhardt/inselberg with sheeting parallel to the surface emerges following the removal of the surrounding weathered material, south central Madagascar.
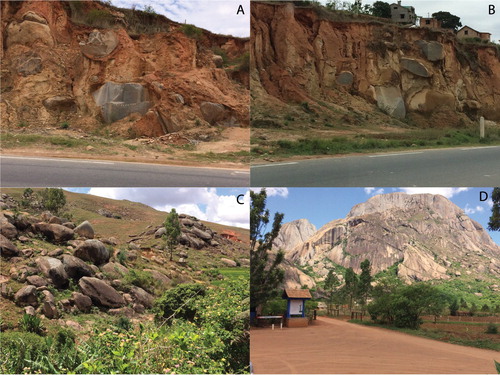
Figure 6. Schematic evolution of Dry Valleys (modified from Kerr, Sugden, & Summerfield, Citation2000). (A) Initial lithospheric extension and rifting. (B) Fluvial denudation to the new sea level removes ∼4 km from the coast and is accompanied by isostatic uplift and faulting. (C) Rivers deepen the Dry Valleys and enhance crustal uplift that raises the basement rocks at the mountain front. (D) The main erosional escarpment near Shapeless Mountain seen from Sesrumnir Valley in the Asgard Range. The isolated mountains in front of the escarpment are part of the Olympus Range. The escarpment can be seen as the equivalent of the Drakensberg escarpment in South Africa. (E) View from Balham Valley towards Victoria Valley in the heart of the Dry Valleys, showing in the distance rectilinear slope elements.
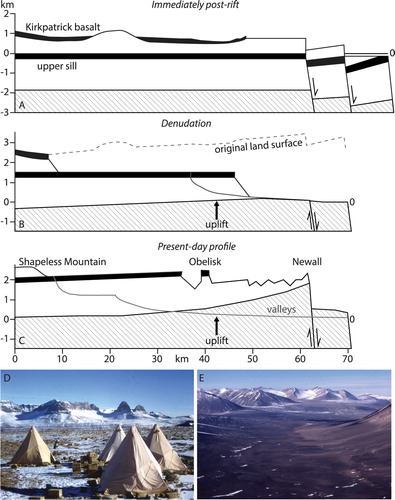
Figure 7. A fluvial landscape fingerprint in the subglacial Gamburstsev Subglacial Mountains (Rose et al., Citation2013). The map shows stream ordering and the dendritic pattern of valleys in individual basins. Below, the long profile of the main rivers displays a concave upwards profile with local over-deepened basins typical of glacial modification.
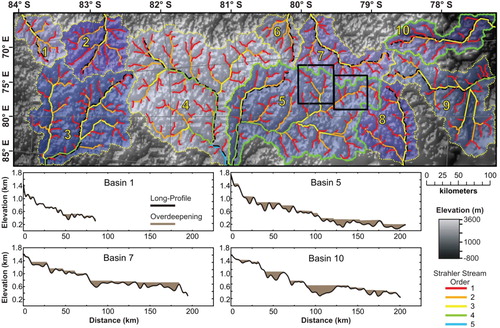
Figure 8. Pre-glacial rivers in Antarctica and estimates of denudation and sediment discharge. (A) Rivers in Antarctica as they would drain on the modern topography rebounded for ice loading. (B) Relief Ratio of Antarctic drainage basins as a proxy for denudation potential following Summerfield and Hulton (Citation1994). (C) Calculated sediment discharge under a warm (25 °C MAAT) climate following Syvitski, Peckham, Hilberman, and Mulder (Citation2003). The sediment discharge from the basin underlying the South Pole is 36 Mt/yr and only marginally more than several other basins. All these values are low in relation to the size of the basins and reflect low rates of denudation.
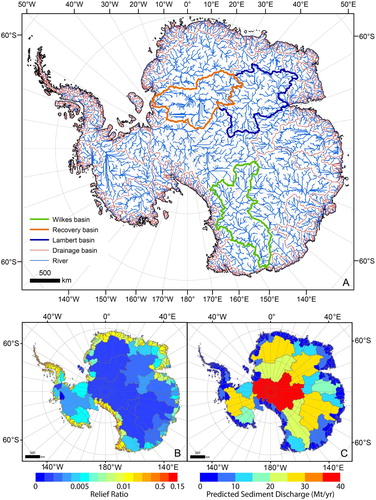
Figure 9. Dissected plateau remnants of the Sarnoff Mountains, Marie Byrd Land, West Antarctica. Tors and weathered corestones occur on adjacent plateau remnants (Sugden, Balco, Cowdery, Stone, & Sass, Citation2005).
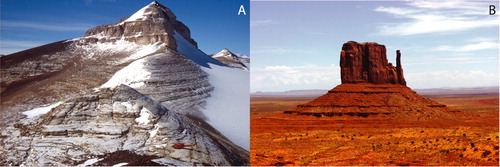
Figure 10. (A) Rectilinear slopes on the flanks of Altar Mountain, Quartermain Mountains, Dry Valleys. The thin regolith that covered slopes of 30°–36° has been removed by overriding ice on the up-ice side to the right. (B) Similar rectilinear slopes in Monument Valley, Arizona, USA.