Figures & data
Figure 1. Study area showing the location of rural communities.
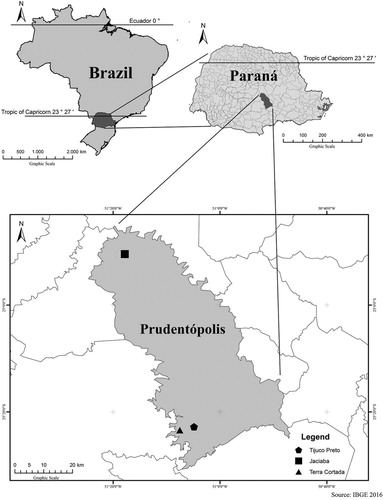
Figure 2. Evolution of bean productivity in Paraná State and its relationship with agricultural modernization and slash-and-burn persistence in Prudentópolis. Source: IBGE.
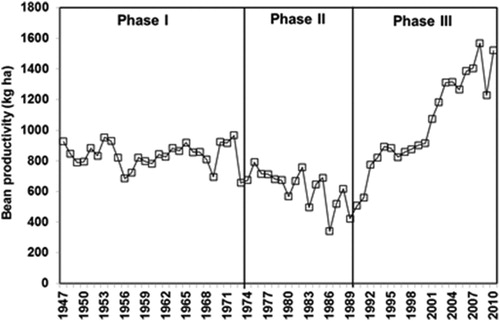
Figure 3. Bean productivity from 1989 to 2010: a) differences in the increase in bean productivity between Paraná State and Prudentópolis, b) comparison of bean productivity in Prudentópolis and other municipalities. Source: IBGE.
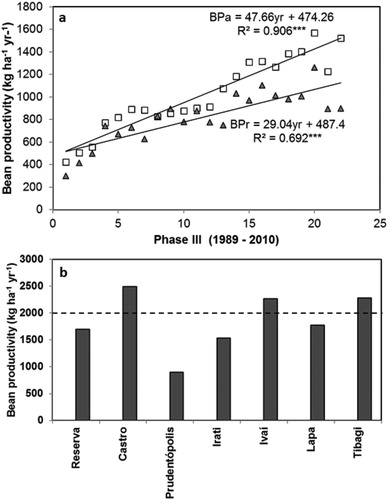
Figure 4. Land use pattern on the slash-and-burn landscape: a) hilly topography displaying a land mosaic with different successional vegetation phases; b) convex steep slope sowed with black beans; c) trunks and twigs not consumed by the fire over the ground.
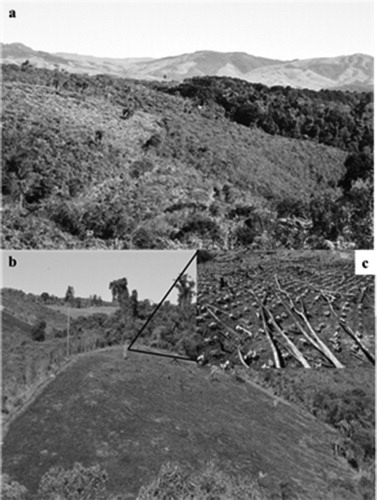
Table 1. Slash-and-burn characteristics and farmer’s perception.
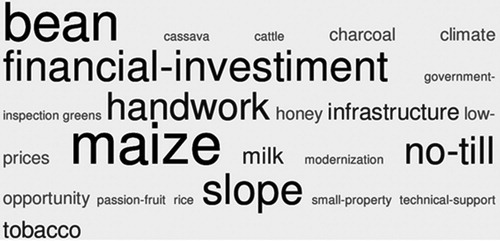
Figure 5. Word cloud displaying the characteristics and constraints of the slash-and-burn system.