Figures & data
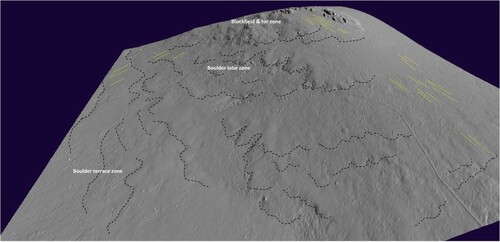
Figure 1. Topographic map of Dartmoor and surrounding areas, showing the locations of the summit sites used in this study (1 – East Mill Tor; 2 – Fur Tor; 3 – Crow Tor; 4 – Great Mis Tor; 5 – Yar Tor; 6 – Fox Tor; 7 – Sheepstor; 8 – Legis Tor; 9 – Hen Tor). The numerically modelled extent of a potential former plateau icefield, as proposed by Evans et al. (Citation2012), is also depicted in light blue.
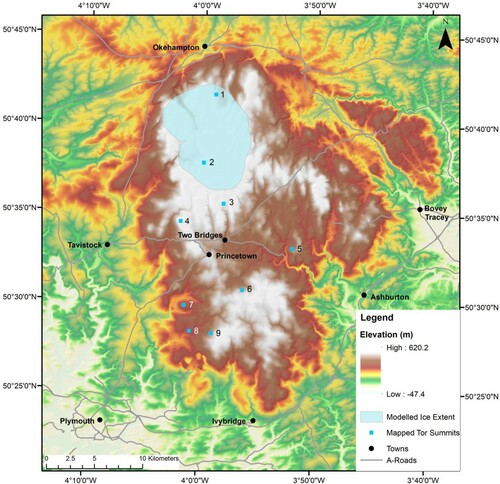
Figure 2. Characteristics of the well-developed periglacial landsystem of Dartmoor: a) existing model of landform-sediment associations (landsystem) for Dartmoor, including summit areas with castellated tors, clitter fields and thin regolith, upper hillsides covered with cryoplanation benches/terraces, boulder lobes and clitter, and lower hillsides with deeper solifluction debris (after Gerrard, Citation1988 and Campbell et al., Citation1998); b) examples of the main landsystem elements and facets, including; i. hilltop profile of Great Staple Tor viewed from the northeast, showing summit tor stacks, cryoplanation bench at left and clitter slope/blockfield; ii. west face of Great Mis Tor, showing cryoplanation bench at the foot of the tor stack, fringed at the right by bolder lobes; iii. view down west slope of Great Mis Tor through the boulder lobes to the stone-fronted lobes of the lower slopes.
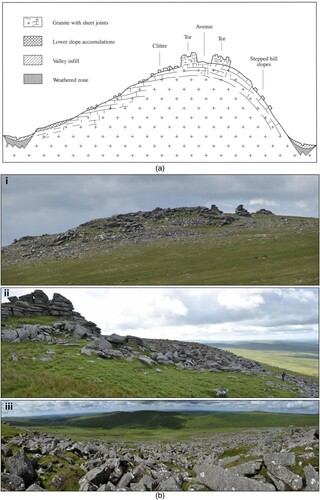
Figure 3. Examples of tor types using the classification scheme of Evans et al. (Citation2012): a) Type 2 on Broad Down, 2 km northwest of Postbridge, northern Dartmoor; b) Type 1, Little Mis Tor; c) Type 1 tor stack/cantilevered blocks, Great Mis Tor.
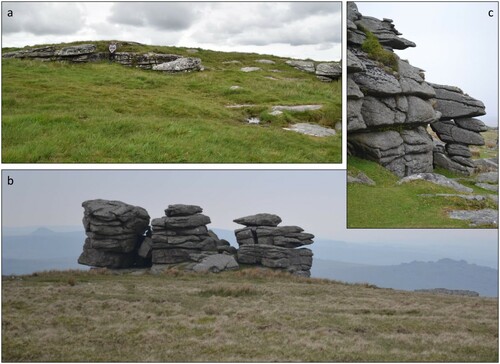
Figure 4. Spectral reflectance graph showing the different reflectance values for two types of vegetation and stone cover. The coloured boxes indicate the wavelengths of the red, green and blue bands used in the classification. Note the divergence in the spectral reflectance between vegetation and stone cover in the blue band.
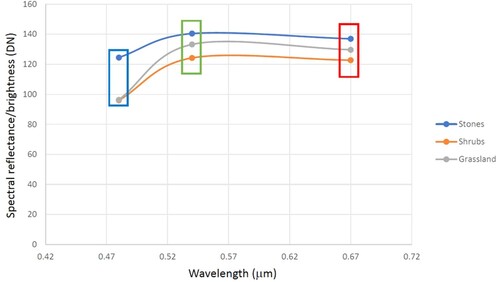
Table 1. Precision recall and f1-scores for Great Mis, Hen and Fur tors
Figure 5. Comparison of the visualisation quality of large scale boulder structures and small scale individual boulders, between the manual digitisation (left) and automatic classification (right) approaches. Red frame marks the extent of the visualisations in the lower panels.
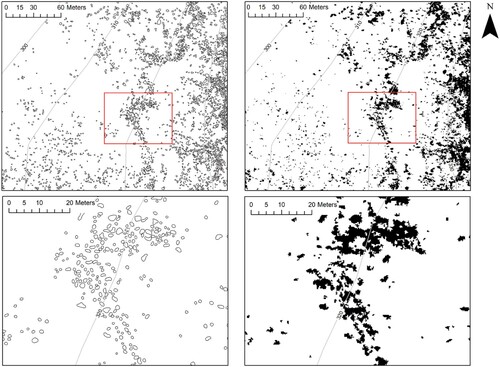
Figure 6. Geomorphology map of East Mill Tor, North Dartmoor.
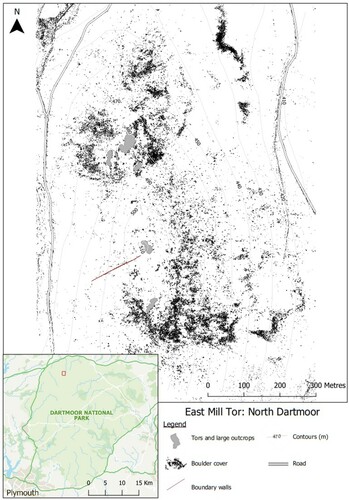
Figure 7. Geomorphology map of Fur Tor, North Dartmoor.
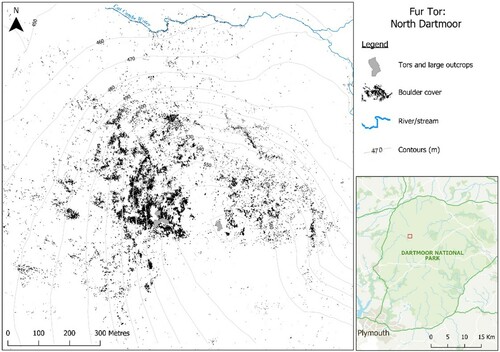
Figure 8. Geomorphology map of Crow Tor, North Dartmoor.
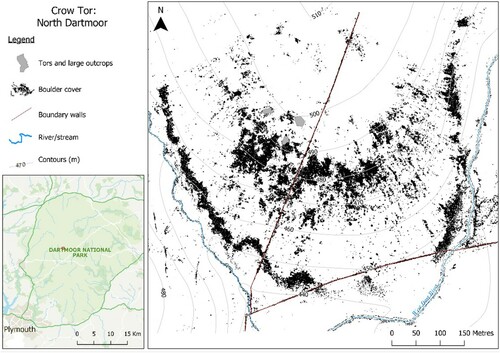
Figure 9. Geomorphology map of Great Mis Tor, Southwest Dartmoor.
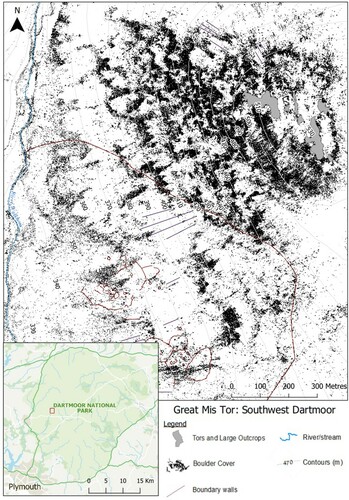
Figure 10. Geomorphology map of Yar Tor, Southeast Dartmoor.
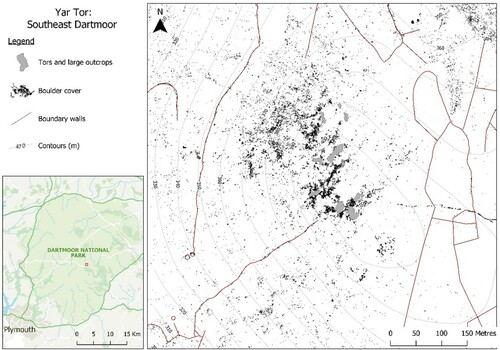
Figure 11. Geomorphology map of Fox Tor, Central South Dartmoor.
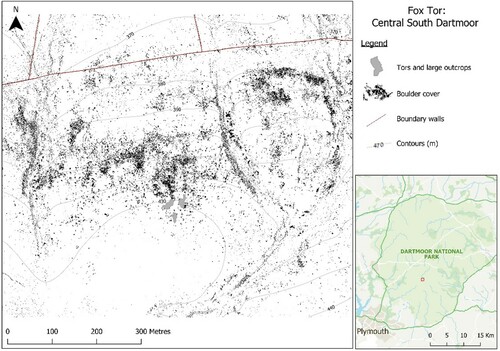
Figure 12. Geomorphology map of Sheepstor, Southwest Dartmoor.
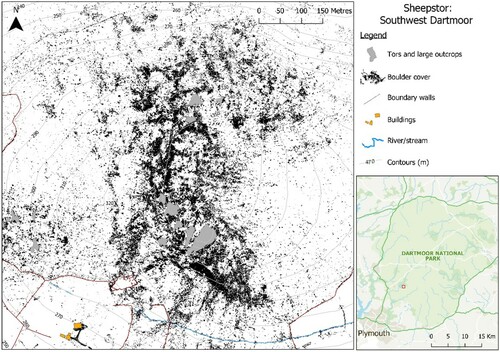
Figure 13. Geomorphology map of Legis Tor, Southwest Dartmoor.
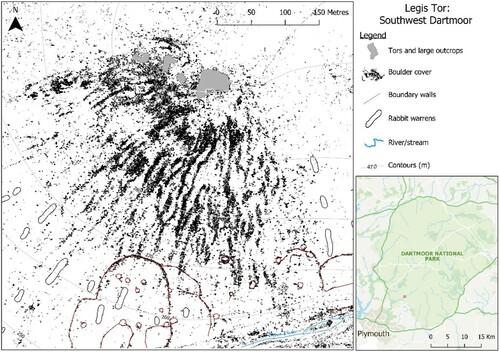
Figure 14. Geomorphology map of Hen Tor, Southwest Dartmoor.
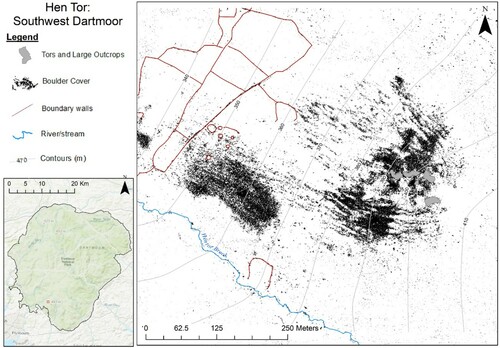
Figure 15. The spatial distribution of tor types across Dartmoor using the classification scheme of Evans et al. (Citation2012) and combining their data with the results of this study.
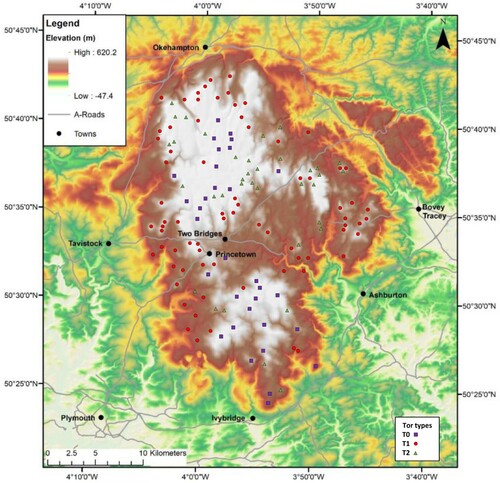
Figure 16. Google Earth aerial images of selected summit tors used in this study, illustrating tor morphology and associated clitter patterns: a) Crow Tor, distance across image is 350 m; b) Hen Tor; c) Fur Tor, distance across image is 800 m; d) Yar Tor; e) Great Mis Tor, with some examples of lateral boulder berms (LB), pendant shapes (PS) and garland patterns (GP) identified.
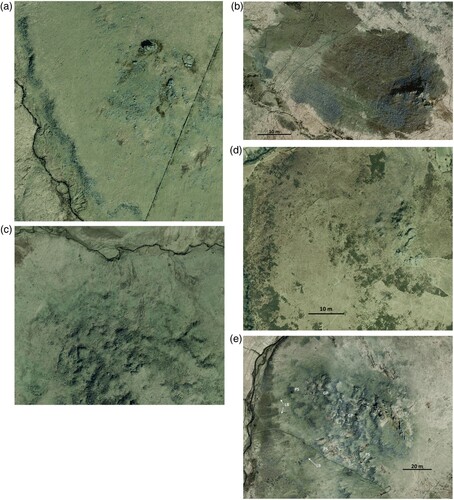
Figure 17. Large boulder fronted lobes on the upper west slope of Great Mis Tor, interpreted as relict permafrost creep features.
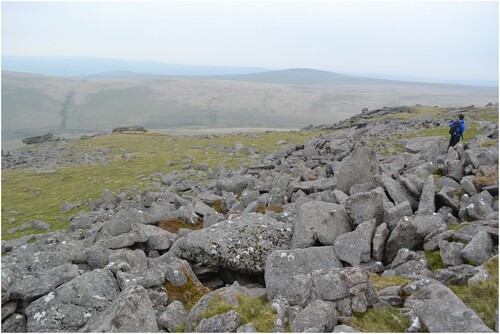
Figure 18. Google Earth aerial image of Legis Tor and its associated blockslope features on its western and southern slopes. This illustrates lateral boulder berms on either sides of narrow and long treads, which appear as boulder stripes on upper slopes and vegetated stripes with occasional surface boulders on lower slopes. Other features representative of all the study sites are human archaeological and cultural remains such as walled enclosures, hut circles, pillow mounds (rabbit warrens), and channelled hummocky topography indicative of tinning activity in the Legis Lake valley to the left of the image.
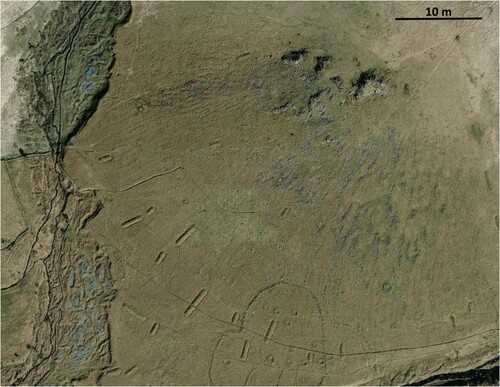
Figure 19. Annotated LiDAR extract (Environment Agency, UK) of the southern and western slopes of Great Mis Tor (view looking towards northeast), illustrating the spatial distribution of periglacial landforms and representative of a periglacial landsystem for Dartmoor. Black dashed lines are the fronts of lobes and terraces. Yellow lines are stone stripes.