
Figures & data
Figure 1. Location of the city of Inverness, Scotland and its main former townships and villages. Created using LiDAR DTM data – crown copyright Scottish Government, SEPA and Scottish Water, and aerial imagery – copyright Getmapping plc.
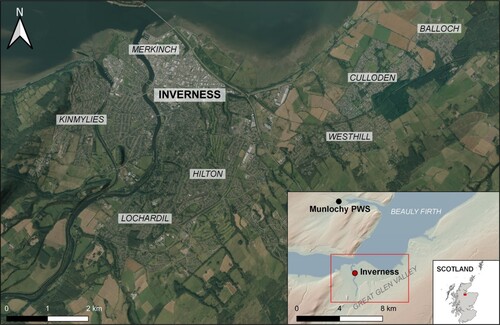
Figure 2. Climate of Inverness, Scotland. Created using 1991–2020 climate data courtesy of the Met Office.
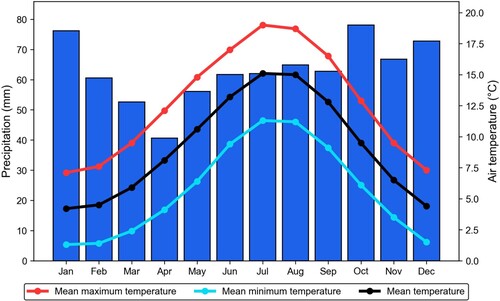
Figure 3. Location of the transect route within the study area, detailing air temperature observation sites with local climate zones (LCZs). Dominant surface type determined using data from Morton et al. (Citation2020).
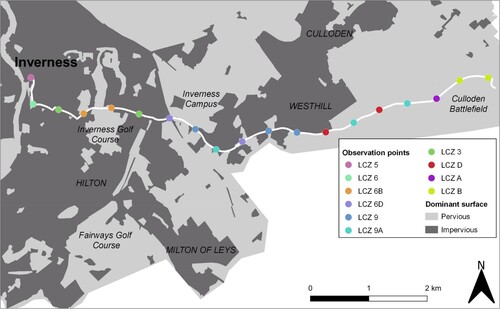
Figure 4. Mean near-surface air temperature profiles for each of the 5 traverses measured along the study transect route from Inverness, Scotland to the surrounding rural countryside over 30 dates between 01/06/2019 and 31/08/2019.
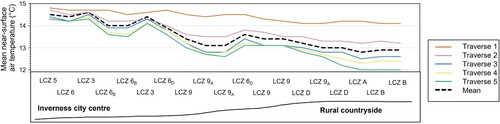
Table 1. Statistical analysis of nocturnal near-surface UHI intensity (UHII) study transect results collected in Inverness between June and August 2019.
Figure 5. Observed nocturnal near-surface urban heat island intensity in Inverness, Scotland on each observation date between 01/06/2019 and 31/08/2019.
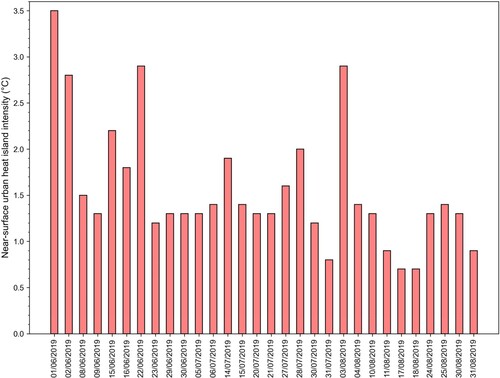
Figure 6. Near-surface air temperature difference between the local climate zones (LCZs) studied in Inverness, Scotland over 30 dates between 01/06/2019 and 31/08/2019.
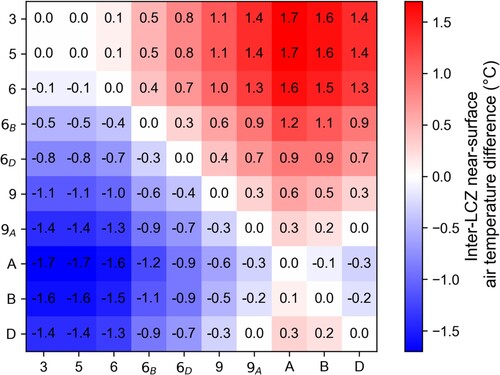
Figure 7. Relationship between mean near-surface air temperature and fraction of impervious surface within 250 m of the observation points studied, by local climate zone (LCZ).
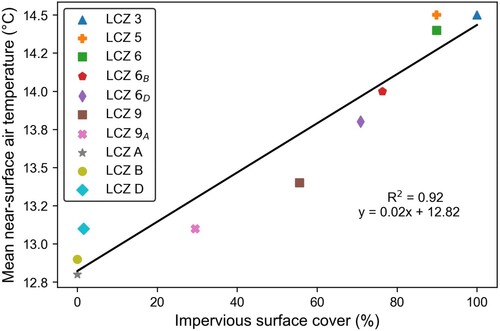
Table 2. Summary of wind and cloud cover conditions at Inverness during the study period.
Figure 8. Relationship between daily nocturnal near-surface urban heat island intensity and (a) wind speed, (b) cloud base height, and (c) mean relative humidity on each of the 30 dates studied between 01/06/2019 and 31/08/2019.
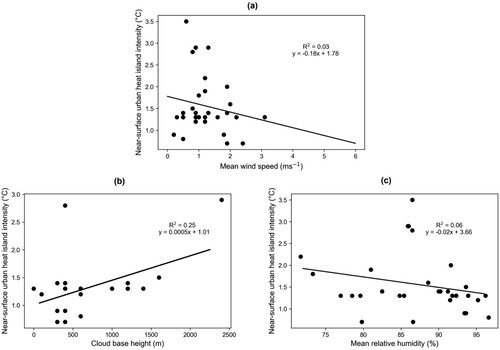
Table 3. Review of near-surface UHI intensity (UHII) in selected cities, by population, latitude, Köppen climate classification and season recorded.