Figures & data
Figure 1. Location of the sampling sites for radiocarbon dating of sub-terrace and supra-terrace organic material. Also shown are the locations of the high-level (∼500 m) blanket peat pollen sampling sites of Binney (Citation1997; pollen site 1) and Paterson (Citation2011; pollen site 2).
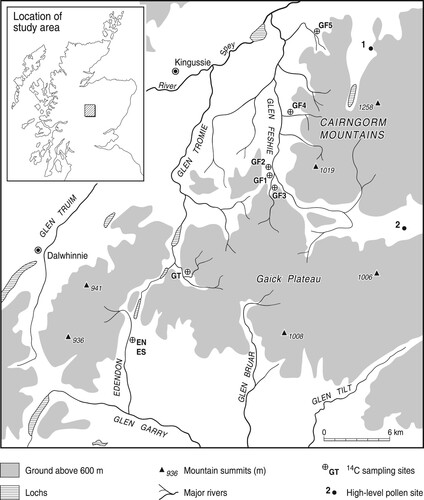
Table 1. Radiocarbon ages relating to the Main Holocene Terrace, central Grampians.
Figure 2. Oblique view of upper Glen Feshie, viewed from the south, showing the sampling locations of samples GF-1, GF-2 and GF-3. GF-3 (56.9976°N, 3.9046°W) is approximately 1.2 km upvalley from GF-1. MHT: Main Holocene Terrace (Google EarthTM image).
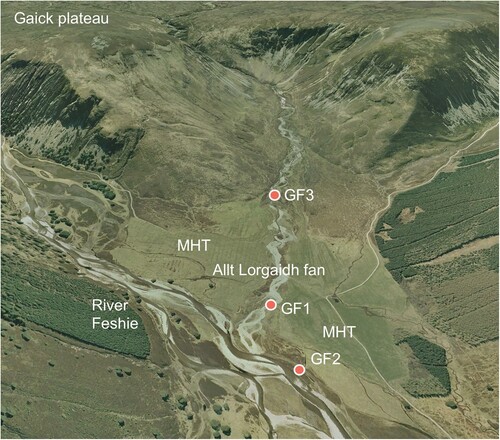
Figure 3. Sections showing the stratigraphic context of the Glen Feshie and Glen Tromie samples; note the differences in vertical scale. The stratigraphy of the Edendon Valley sampling sites is illustrated in Ballantyne and Whittington (Citation1999).
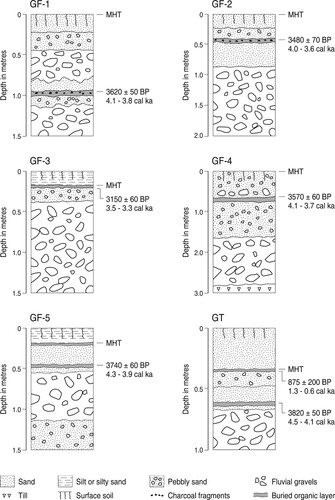
Figure 4. Oblique view of the Allt Domhainn Fan (56.9925°N, 4.0269°W) viewed from the southwest in 2005, showing the location of the site from where samples GT-1 and GT2 were obtained. The distance from the apex of the fan to its toe is 350 m. The toe of the fan is partly truncated by the Allt Gharbh Ghaig, a tributary of the River Tromie (Google EarthTM image).
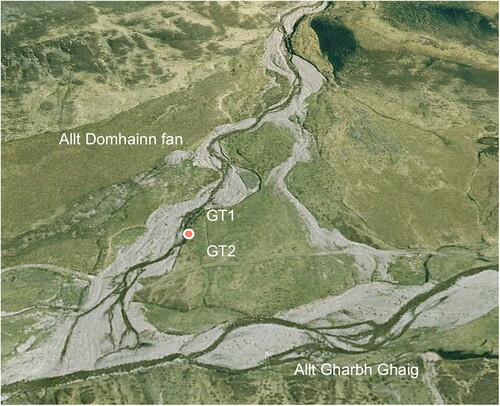
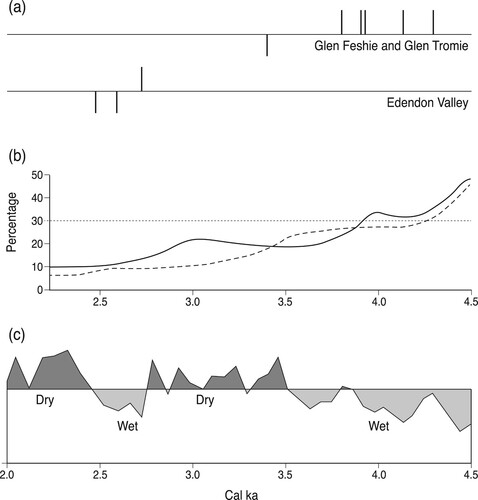
Figure 5. Environmental changes in the study area, 4.5–2.0 cal ka. (a) Maximal ages for floodplain and fan aggradation (upticks) and incision (downticks) as represented by the sub-terrace and supra-terrace radiocarbon ages obtained in Glen Feshie and Glen Tromie (top) and the Edendon Valley (bottom). The ticks represents the median calibrated radiocarbon age. (b) The trajectory of decline in pine woodland cover as represented by Pinus sylvestris pollen as a percentage of total land pollen; 30% approximates the point at which only isolated stands of pine occurred at the pollen sites. Curve 1 (dashed line) is for 500 m in Glen Einich, based on data in Binney (Citation1997); curve 2 is for 510 m at Geldie Lodge, based on data in Paterson (Citation2011). (c) Standardised records of periods of increased wetness (below the line) and dryness (above the line) at Mallachie Moss (Langdon & Barber, Citation2005).