Figures & data
Table 1. Classification of different combinatorial strategies based on timing regimen and mechanism.
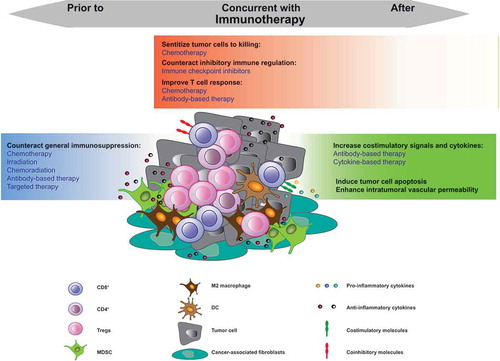
Figure 1. Illustration of different timing schedules of various therapies in combination with immunotherapy based on their mechanisms. The individual examples of each combination therapy are summarized in . The colour gradients show the time points (prior, concurrent and/or after immunotherapy) at which the therapies are mostly applied. The blue box shows the therapies which are mostly applied prior to immunotherapy and less often concurrent with immunotherapy. The orange box shows the therapies which are often applied concurrent with immunotherapy and less after immunotherapy. The green box shows the therapies which are used mainly after immunotherapy and less concurrent with immunotherapy. Abbreviations: Tregs: Regulatory T-cells, MDSC: Myeloid-derived suppressor cells, M2 macrophages: type 2 macrophages, DC: dendritic cell.