Figures & data
Figure 1. MCLA-117, a CLEC12AxCD3 full length IgGs bispecific specifically binds to CLEC12APOS and CD3POS target cells.
(a) Schematic representation of MCLA-117 and the contribution of each domain to the functionality of MCLA-117. cLC: common light chain; 'DE' 'KK': amino acid substitutions L351D, L368E and L351K, T366K introduced to promote heavy chain heterodimerization. (b) Binding of MCLA-117 to CLEC12A and CD3 was determined on a panel of tumour cell lines by flow cytometry. HL60: CLEC12APOS promyelogenous cell line; CLEC12A-CHO-K1: CHO-K1 cell line stably expressing human CLEC12A (validated with reference anti-CLEC12A antibody, data not shown); CHO-K1: CLEC12ANEG parental CHO-K1 cell line; Jurkat E6.1: CD3POS T cell line; J.RT-T3.5: CD3NEG T cell line. (c) MCLA-117 binding profile in normal peripheral blood by flow cytometry. Gating strategy for analysed subsets were CD4 T cells: CD4POS; CD8 T cells: CD8POS; NK cells: CD3NEGCD56POS; NKT cells: CD3POSCD56POS; B cells: CD19POS; myeloid dendritic cells (DC): BDCA1POSCD19NEG; granulocytes: based on SSC-FSC; monocytes: CD14POSCD33POS. (d) MCLA-117 binding within CD34POS progenitor compartment in normal bone marrow by flow cytometry, gating strategy is indicated in figure. HSC: haematopoietic stem cell; MPP: multipotent progenitor; CMP: common myeloid progenitor; GMP: granulocyte-macrophage progenitor; MEP: megakaryocyte-erythroid progenitor; CLP: common lymphoid progenitor. Data shown for MCLA-117 and isotype control IgG formatted with the final Fc format (silenced Fc effector function).
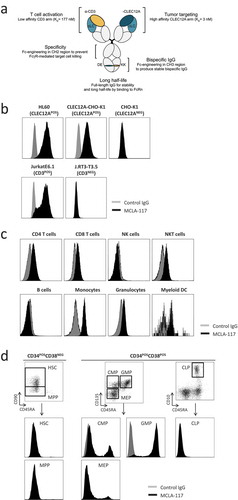
Figure 2. MCLA-117 mediates CLEC12A-dependent activation of T cells and redirects these T cells to induce lysis of a CLEC12APOS HL60 cells.
Resting T cells derived from healthy donors were purified by negative selection and co-cultured with CFSE-labelled HL60 cells in the presence of antibodies or PBS. Firstly, the activity of a prototype MCLA-117 with wild-type (WT) Fc effector function, dubbed as MCLA-117*, was analyzed and compared to MockxCD3* control IgG (formatted with WT Fc function) (a-b). Subsequently MCLA-117, Fc effector function silenced, was functionally evaluated (c-e). (a-b) Cells were co-incubated at an E:T ratio of 5:1 together with MCLA-117* and MockxCD3* (both WT Fc function) at an IgG concentration of 1,000 ng/mL. The capacity of MCLA-117* function to induce T cell activation (a) and target cell lysis (b) was quantified after 24/48/72 hours by flow cytometry relative to the PBS condition. The data shown are from two representative healthy donors out of >10 tested. (c-e) Cells were co-incubated at an E:T ratio of 5:1 with indicated IgGs – all with silenced Fc effector function – at a range of IgG concentrations. The capacity of MCLA-117 (with silenced Fc effector function) to induce activation of CD4 and CD8 T cells (c, d) and target cell lysis (e) was quantified after 48 hours by flow cytometry relative to the PBS condition. The data shown are from a representative donor, whereby a total of six donors were tested in three independent assays.
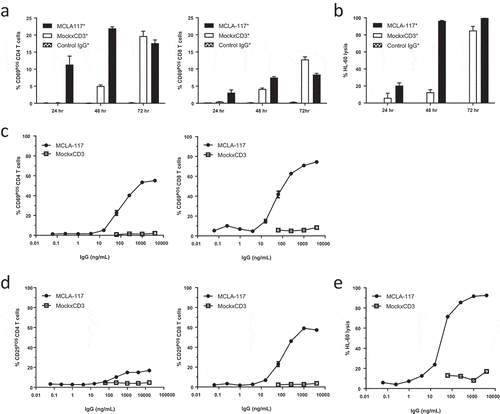
Table 1. Mean EC50 values of MCLA-117-induced T cell activation and target cell lysis.
Figure 3. MCLA-117 induces CLEC12A-mediated lysis of monocytes, and inflammatory cytokine release, and has the capacity to induce CLEC12A-antigen specific T cell proliferation.
(a-c) Healthy donor-derived PBMC samples were co-cultured with MCLA-117 or MockxCD3 antibody at the indicated concentration range and compared to the PBS condition. T cell activation (a), monocyte lysis by autologous T cells (b) and B cell lysis (c) were assessed after 48 hours using flow cytometry. (d) Monocytes derived from healthy donors were purified by negative selection and co-cultured with CFSE-labelled resting autologous T cells at an E:T ratio of 5:1 with MCLA-117 and MockxCD3 antibody at 1,000 ng/mL (anti-CD3 IgG was formatted with WT Fc effector function) for 5 days. T cell proliferation was demonstrated by the reduction of CFSE-positive T cells. (e) Healthy donor-derived PBMCs were cultured with 1,000 ng/mL MCLA-117, MockxCD3 or anti-CD3 (CD3) antibody for 48 hours. Subsequently, supernatant was harvested to measure the human cytokine levels in these supernatants using a human 10-plex Luminex setup. Cytokine levels were detectable for the six cytokines shown. Data shown in (a-d) are from a single donor and are representative of four independent donors from multiple independent experiments. Data shown in (e) are from two representative healthy PBMC donors, with duplicates for each donor, whereby PBMCs from eight healthy donors were tested.
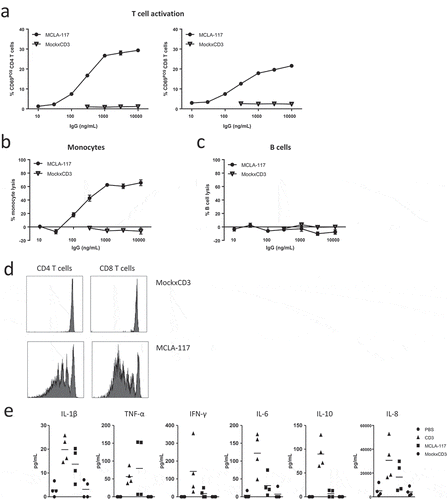
Figure 4. MCLA-117 spares the potential of normal bone marrow progenitor cells to develop the complete myeloid and erythroid lineage.
CD34POS hematopoietic progenitor cells from healthy donor bone marrow were co-cultured with autologous pre-activated T cells in the presence of 200 ng/mL MCLA-117 or MockxCD3 at an E:T ratio of 10:1 for 16 hours. (a) Using a quantified flow cytometry setup, MCLA-117-induced lysis was determined relative to non-IgG condition for the indicated cell fractions. Each data point represents the mean value for an independent bone marrow donor tested in triplicate (n = 4). Gating strategy is described in Supplementary Figure 4. (b) Analyses of the impact of MCLA-117 on different CD34POS bone marrow populations after 16 hour cytotoxicity assay, showing absolute number for three donors. Gating of CD34POS progenitor cells is depicted in Supplementary Figure 5. Quantification of absolute number in the different test conditions was calculated by integration of the frequency and absolute count of total CD34POS cells determined with flow count fluorospheres. Data show mean of duplicate measurement. (c) Scatter plots showing impact of MCLA-117 on CLEC12A- and/or CD123-expressing subsets after 16 hours cytotoxicity assay for indicated conditions, gated on CD34POSLINNEG cells. One representative donor out of two shown. (d) Capacity of CD34POS cells upon 16 hours cytotoxicity assay with MCLA-117 to give rise to granulocyte-macrophage colonies (CFU-GM), burst-forming units-erythrocyte (BFU-E) and megakaryocyte colonies (CFU-Mk) was quantified after two weeks culture in semi-solid medium, from four different donors. Control cultures are either non-IgG treated co-cultures or CD34POS cells seeded alone. Each data point represents the mean value of triplicate cultures (CFU-GM and BFU-E) or quadruplicates (CFU-Mk) per donor. (e) Flow cytometric analysis of CD15POSCD33POS and CD14POSCD36POSCD33POS cell content of the two week MethoCult cultures described in (d). Data show the frequency of monocytic and myelocytic cells out of total CD33POS cells for three different donors. HSC: haematopoietic stem cell; MPP: multipotent progenitor; CMP: common myeloid progenitor; GMP: granulocyte-macrophage progenitor; MEP: megakaryocyte-erythroid progenitor; CLP: common lymphoid progenitor. Statistical analysis was performed using paired student’s t test. *p < 0.05, **p < 0.01, ***p < 0.001.
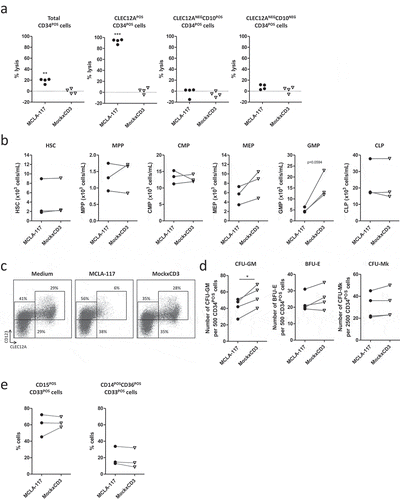
Figure 5. MCLA-117 efficiently induces redirected lysis of CLEC12APOS primary AML blasts by autologous T cells.
Resting CD3POS T cells isolated from the peripheral blood of AML patients in clinical remission were co-cultured for 48 hours with CFSE-labelled CLEC12APOS autologous primary AML blasts collected at AML diagnosis. The E:T ratio was 5:1 and IgGs were added at a concentration of 1,000 ng/mL: MCLA-117, MockxCD3 or control IgG. The extent of AML blast lysis induced by each IgG relative to the PBS condition was quantified using flow cytometry. (a) Diagram showing stage of AML at which the AML blast samples and autologous T cells were obtained. (b) Expression of CLEC12A antigen on primary AML blast samples (AML blast defined as CD45±SSC±). The histograms show anti-CLEC12A IgG binding for each patient sample, with lymphocytes indicated in grey and AML blasts in black. The gate for CLEC12A positivity was set based on the CLEC12A-negative lymphocyte fraction; percentage CLEC12A positive blasts is given. (c-d) Activation status of AML patient CD4POS (c) and CD8POS T cells (d). (e) Cytotoxicity of CLEC12APOS primary AML blasts mediated by autologous primary T cells when incubated with indicated IgG (relative to PBS). The data shown are mean ± SE of three AML patient samples (patients 7–9, see Supplemental Table 1) tested in triplicate. Data were analysed by ANOVA relative to PBS: ** p < 0.01, *** p < 0.001.
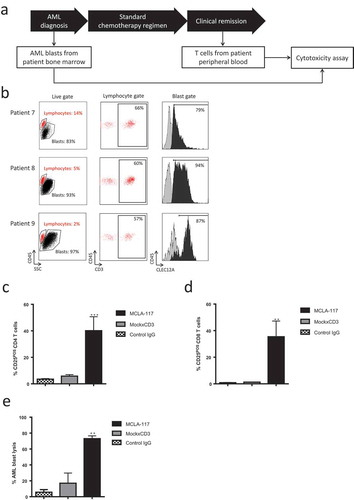
Table 2. MCLA-117 induces AML blast lysis and T cell expansion in primary AML samples.
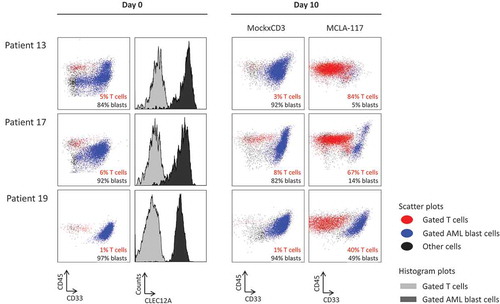
Figure 6. MCLA-117 induces AML blast killing in primary AML samples.
Primary AML patient samples taken at AML diagnosis were cultured for 10 days in medium supplemented with a cytokine cocktail to support AML blast survival. MCLA-117 or MockxCD3 antibodies were added at 200 ng/mL. For each patient, the CD45xCD33 plots show the live gate for day 0 and for each IgG at day 10. The T cells are shown in red, the AML blasts in blue (defined as CD45±SSC±), with the percentages of T cells and AML blasts indicated. Histograms at day 0 show for each patient the CLEC12A expression levels of AML blast cells. Staining using an anti-CLEC12A antibody is shown in black and staining using an isotype control antibody is shown in grey.