Figures & data
Figure 1. Study design. (Cohen et al. Arthritis Res Ther. 2018;20:155. © The Author(s). Reprinted with permission [https://creativecommons.org/licenses/by/4.0/]). a A sample size of approximately 614 patients was planned for enrolment; the actual number of patients randomized was 650. b Intravenous PF-SZ-IFX or ref-IFX-EU 3 mg/kg was given as an induction regimen at Weeks 0, 2, and 6, followed by maintenance treatment with a 3-mg/kg dose starting at Week 14 and continuing every 8 weeks thereafter. Dose escalation to 5 mg/kg PF-SZ-IFX or ref-IFX-EU was permitted at or after Week 14 for patients with inadequate RA response. EOT, end of treatment; PF-SZ-IFX, PF-06438179/GP1111; RA, rheumatoid arthritis; ref-IFX-EU, infliximab authorized in the European Union.
![Figure 1. Study design. (Cohen et al. Arthritis Res Ther. 2018;20:155. © The Author(s). Reprinted with permission [https://creativecommons.org/licenses/by/4.0/]). a A sample size of approximately 614 patients was planned for enrolment; the actual number of patients randomized was 650. b Intravenous PF-SZ-IFX or ref-IFX-EU 3 mg/kg was given as an induction regimen at Weeks 0, 2, and 6, followed by maintenance treatment with a 3-mg/kg dose starting at Week 14 and continuing every 8 weeks thereafter. Dose escalation to 5 mg/kg PF-SZ-IFX or ref-IFX-EU was permitted at or after Week 14 for patients with inadequate RA response. EOT, end of treatment; PF-SZ-IFX, PF-06438179/GP1111; RA, rheumatoid arthritis; ref-IFX-EU, infliximab authorized in the European Union.](/cms/asset/c4b94fbf-f062-4801-8aca-9768c47b4630/iebt_a_1635583_f0001_b.gif)
Figure 2. PopPK model development schematic. PF-SZ-IFX, PF-06438179/GP1111; PopPK, population pharmacokinetics; ref-IFX-EU, infliximab authorized in the European Union; VPC, visual predictive check.
Table 1. Covariates included in population pharmacokinetic analysis.
Table 2. Summary of demographics and key parameters by treatment groupa.
Table 3. Final model parameter estimates and CIs for the ref-IFX-EU and PF-SZ-IFX arms.
Figure 3. Diagnostic plots for final model for the ref-IFX-EU arm (a) and the PF-SZ-IFX arm (b). In the scatter plots of observations vs. predictions, the solid red line and dashed blue line show the reference line (diagonal line) and linear regression line based on the individual data points. In the scatter plots of residuals, the solid and dotted lines show the reference line (y = 0) and the locally weighted scatter-plot smoothing trend line (LOESS), respectively. Observed concentrations and individual predictions were log-transformed. PF-SZ-IFX, PF-06438179/GP1111; ref-IFX-EU, infliximab authorized in the European Union.
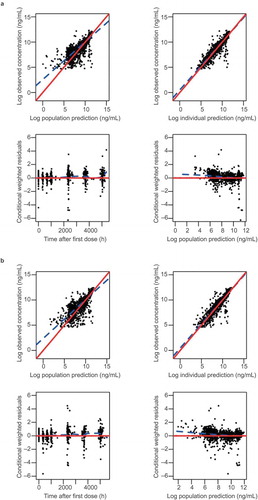
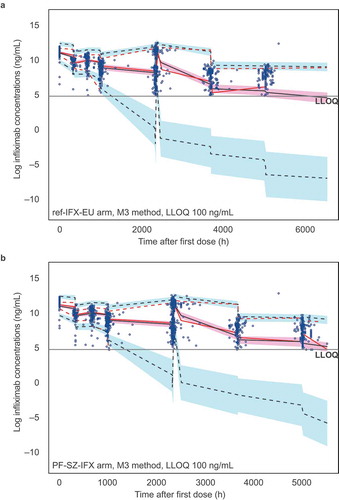
Figure 4. VPC for final model for the ref-IFX-EU arm (a) and the PF-SZ-IFX arm (b). Blue circles represent the observed data, and red lines represent the median (solid line), 5th percentile (dashed line), and 95th percentile (dashed line) of the observed data. For 1000 simulated trials, the median, 5th percentile, and 95th percentile of simulated concentrations were calculated for each time point and are represented by black lines. The 95% CI for simulated median and each percentile are shown by light pink and light blue shaded areas. CI, confidence interval; h, hours; LLOQ lower limit of quantification; PF-SZ-IFX, PF-06438179/GP1111; ref-IFX-EU, infliximab authorized in the European Union; VPC, visual predictive check.