
Figures & data
Figure 1. Flowchart of patients’ enrollment.
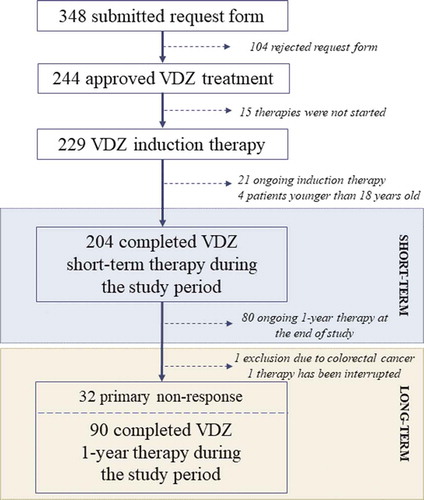
Table 1. Clinical and demographic data of enrolled inflammatory bowel disease patients.
Figure 2. (a) This is a half violin with each observation records displayed in dots. In Crohn’s disease, the average disease duration was significantly higher in patients with complete endoscopic remission compared with patients without endoscopic healing during long-term vedolizumab therapy (11.75 vs. 5.27, p < 0.007). (b) ROC curve shows 83.9% of patients correctly attributed to the endoscopic healing group using 6.5-year disease duration cutoff.
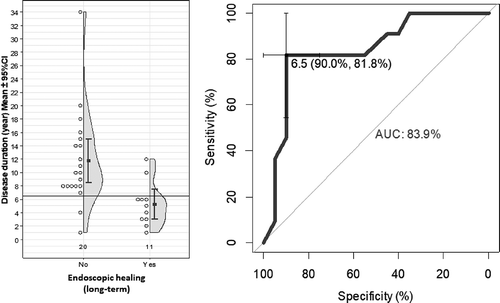
Table 2. Assessment of endoscopic healing predictors during short- and long-term vedolizumab therapy (L, location of disease; L1, ileal; L2, colonic; L3, ileocolonic; B, behavior of disease; B1, inflammatory; B2, stricturing; B3, penetrating; 5-ASA, 5-amino-salicilate; anti-TNF-α, anti-tumor necrosis factor-α).
Figure 3. Short- and long-term efficacy of vedolizumab therapy on clinical response, remission, steroid-free remission, and endoscopic healing (UC, ulcerative colitis; CD, Crohn’s disease).
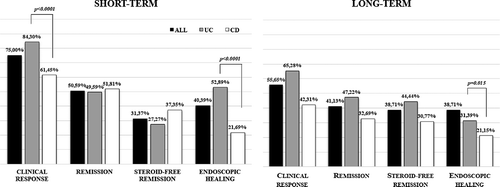
Figure 4. (a–b) Mean Crohn’s Disease Activity Index (CDAI: in short-term subgroups 303.58 [95% CI, 289.59–317.57] vs. 157.66 [95% CI, 145.80–189.52] and in long-term subgroup CDAI: 309.67 [95% CI, 294.83–324.52] vs. 172.65 [95% CI, 145.32–199.99] vs. 184.08 [95% CI, 154.61–213.54]) and Mayo score (in short-term subgroup 9.74 [95% CI, 9.48–9.99] vs. 4.33 [95% CI, 3.82–4.84] and in long-term subgroups 9.60 [95% CI, 9.24–9.95] vs. 4.38 [95% CI, 3.51–4.80] vs. 4.38 [95% CI, 3.61–5.14]) significantly decreased during short- and long-term vedolizumab therapy compared with baseline. (c) Mean Simple Endoscopic Score for Crohn’s Disease (SES-CD) significantly decreased from 20.89 (95% CI, 16.52–25.26) to 13.48 (95% CI, 9.09–17.86) in short-term subgroup and from 19.49 (95% CI, 17.07–21.91) to 12.04 (95% CI, 9.54–14.54) by the end of short-term and to 12.80 (95% CI, 10.11–15.50) by the end of long-term vedolizumab therapy in the long-term subgroup. (d) Percentage component bar chart shows the distribution of different endoscopic Mayo (eMayo) scores in the study population at baseline and at the end of short- and long-term vedolizumab treatment.
![Figure 4. (a–b) Mean Crohn’s Disease Activity Index (CDAI: in short-term subgroups 303.58 [95% CI, 289.59–317.57] vs. 157.66 [95% CI, 145.80–189.52] and in long-term subgroup CDAI: 309.67 [95% CI, 294.83–324.52] vs. 172.65 [95% CI, 145.32–199.99] vs. 184.08 [95% CI, 154.61–213.54]) and Mayo score (in short-term subgroup 9.74 [95% CI, 9.48–9.99] vs. 4.33 [95% CI, 3.82–4.84] and in long-term subgroups 9.60 [95% CI, 9.24–9.95] vs. 4.38 [95% CI, 3.51–4.80] vs. 4.38 [95% CI, 3.61–5.14]) significantly decreased during short- and long-term vedolizumab therapy compared with baseline. (c) Mean Simple Endoscopic Score for Crohn’s Disease (SES-CD) significantly decreased from 20.89 (95% CI, 16.52–25.26) to 13.48 (95% CI, 9.09–17.86) in short-term subgroup and from 19.49 (95% CI, 17.07–21.91) to 12.04 (95% CI, 9.54–14.54) by the end of short-term and to 12.80 (95% CI, 10.11–15.50) by the end of long-term vedolizumab therapy in the long-term subgroup. (d) Percentage component bar chart shows the distribution of different endoscopic Mayo (eMayo) scores in the study population at baseline and at the end of short- and long-term vedolizumab treatment.](/cms/asset/a7528e80-d6fb-416c-a324-1cc19048095c/iebt_a_1699529_f0004_oc.jpg)
Figure 5. Serum C-reactive protein (CRP) decreases during short-term vedolizumab (VDZ) therapy was significantly higher in clinical responders compared with nonresponders. However, correlation between platelet count (PLT) and clinical response was only observed in Crohn’s disease (CD). Hemoglobin levels did not significantly differ between responders and nonresponders by the end of short-term treatment. (UC, ulcerative colitis).
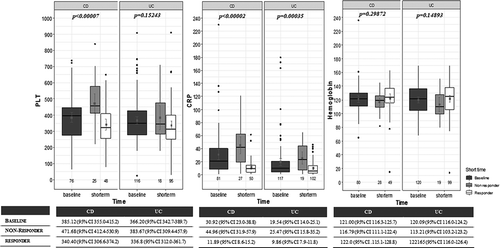
Table 3. Correlation between therapeutic response and vedolizumab trough (VDZ-TL) levels using 15 μg/mL cutoff value.