Figures & data
Table 1. Multivariate logistic regression analysis (step-wise analysis) of predictors of PASI response after treatment with secukinumab
Figure 1. Association analysis between rs13191343, rs13207315, rs1131118, rs12189871, rs4406273, rs12191877, and rs10484554 SNPs and clinical responses to secukinumab treatment. Univariate logistic regression analysis was performed to evaluate the association between (A) rs13191343 (HLA-C_promoter1) or rs13207315 (HLA-C_promoter2), (B) rs1131118 (HLA-Cw6), rs12189871 (HLA-Cw6_LD1) or rs4406273 (HLA-Cw6_LD3), and (C) rs12191877 (HLA-Cw6_LD2) or rs10484554 (HLA-Cw6_LD5) with the clinical response to secukinumab after 8, 16, 24, 40, 56, 64, 72, 88 and 100 weeks of treatment, in a cohort of patients (n = 62) affected by moderate-to-severe psoriasis. Graphs show the percentage and the number of patients (n Pz) carrying (SNP-POS, dark gray line) or not (SNP-NEG, gray line) the SNPs and achieving 75% reduction of PASI score (PASI75), 90% reduction of PASI (PASI90) and 100% reduction (PASI100). rs13191343 and rs13207315, rs1131118, rs12189871 and rs4406273, as well as rs12191877 and rs10484554 showed the same pattern of presence/absence in the psoriatic population and, thus, identical logistic regression curves. *p value < 0.05 were considered significant
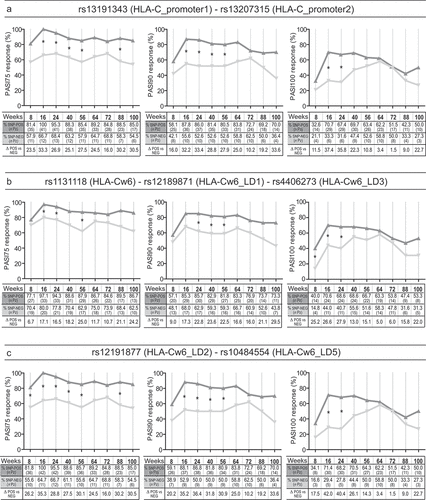
Figure 2. Association analysis between rs9267325 SNP and clinical response to secukinumab. Rs9267325 (MICB-DT_v2)-negative (SNP-NEG, gray line) patients reached a significant better response to secukinumab than positive patients (SNP-POS, dark gray line), in terms of achievement of PASI75 (A), PASI90 (B) and PASI100 (C), as evaluated by logistic regression analysis. The univariate logistic regression analysis is also summarized in the forest plot in the lower panel. The condition of good response to secukinumab is more likely to occur in the group of patients not carrying the allele, as indicated by the odds ratio (OR) < 1. Squares on the x-axis shows odd ratio (OR), squares indicate OR estimates for each observation point and the error bars represent 95% confidence interval (CI). *p value < 0.05 were considered significant and indicated in font bold
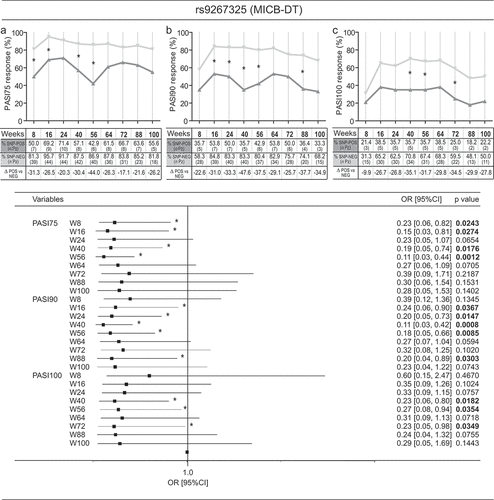
Figure 3. Rs34085293 and rs2304255 SNPs associate with an optimal clinical response to secukinumab treatment. The presence of rs34085293 (DDX58_v1) and rs2304255 (TYK2_v3) variants determined an optimal response to secukinumab treatment at several time-points of observation. The upper and lower graphs show respectively the percentage and the number (n Pz) of DDX58_v1-positive (SNP-POS, dark gray line) and -negative (SNP-POS, gray line) subjects (A) or TYK2_v3-positive (SNP-POS, dark gray line) and -negative (SNP-POS, gray line) (B) patients achieving 100% reduction in the PASI score (PASI100). The relative univariate logistic regression analyses are summarized in forest plots in the right panels, where the x-axis shows odd ratio (OR), squares indicate OR estimates for each observation point and the error bars represent 95% confidence interval (CI). *p value < 0.05 were considered significant and indicated in font bold
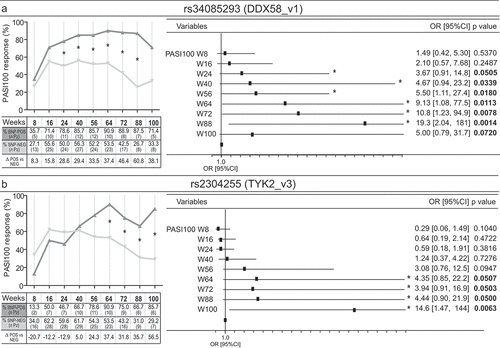
Figure 4. HLA-Cw6 status identifies specific SNP patterns in psoriatic patients correlating with clinical response to secukinumab. Clustering of patients based on presence of SNPs and response to secukinumab was performed by CAP on a cohort of psoriatic patients (n = 53), classified as high responders to secukinumab (PASI90 or PASI100 achievement at week 56) or low responders (unsatisfactory responses or achievement of PASI75 or less at week 56). (A) CAP ordination plot shows a significant clustering of psoriatic patients belonging to HLA-Cw6+ and HLA-Cw6− groups along x-axis, and, in particular, to four established subgroups: HLA-Cw6+ high-responders (downward triangles), HLA-Cw6+ low-responders (triangles), HLA-Cw6− high-responders (diamonds), and HLA-Cw6− low-responders (squares) to secukinumab. The percentage of patients carrying similar SNP profiles, based on the response to secukinumab and HLA-Cw6 status, and relative to leave-one-out allocation of observations to groups, are shown in panel A. The length of each vector line corresponds to the strength of the correlation and direction for each SNP (squared canonical correlations δ12 = 0.89 and δ22 = 0.25; p = 0.0002; 69.8% of sampling units correctly classified). Univariate logistic regression analysis was employed to evaluate the association between rs1004819 (IL23R_v4) (B), rs2201841 (IL23R_v5) (C), rs71562288 (TRAF3IP2_v1) (D) or rs2304255 (TYK2_v3) (E) and PASI90 response at 8, 16, 24, 40, 56, 64, 72, 88 and 100 weeks of treatment, in HLA-Cw6+ (left column) and HLA-Cw6− (right column) patient groups. *p values < 0.05 were considered significant
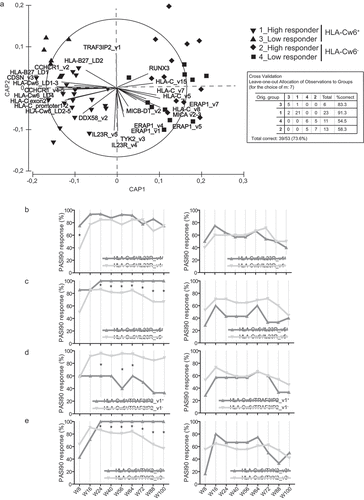
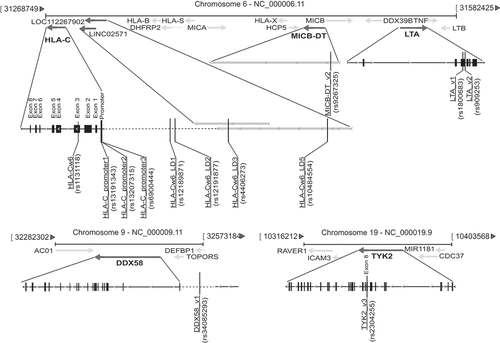
Figure 5. Scheme of SNPs associated with response to secukinumab and relative positions on chromosomes 6, 9 and 19. A schematic representation of all the identified SNPs associating with optimal response to secukinumab, and their relative positions (vertical lines) within gene and adjacent regions of chromosomes 6, 9 and 19 are shown. While HLA-C-related SNPs, together with those present in MIC-DT (rs9267325) and LTA (rs1800683 and rs909253), map within PSORS1 locus of chromosome 6, DDX58_v1 (rs34085293) and TYK2_v3 (rs2304255) SNPs localize in chromosome 9 and 19, respectively. Black boxes with continuous lines schematically represent exons and introns of genes, whereas dashed lines the intergenic regions. Gray bars indicate characterized or predicted lncRNAs, and arrows show the direction of transcription