Figures & data
Figure 1. PRISMA 2009 Flow Diagram
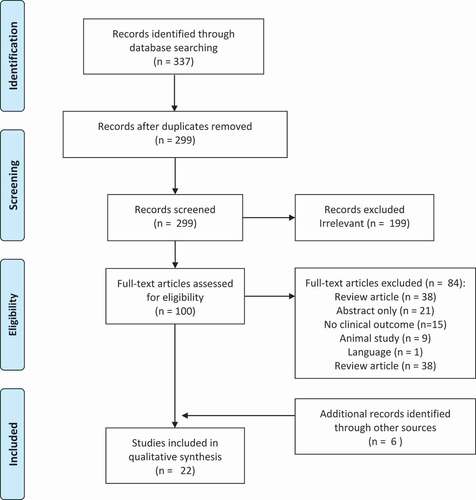
Table 1. Study characteristics and levels of evidence
Figure 2. Assessment of risk of bias
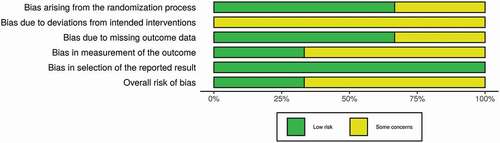
Table 2. Risk of bias domains
Table 3. Risk of Bias assessments using AHRQ tool
Figure 3. Hedges d effect sizes are shown for the pre-post mean difference in each outcome between intervention and control groups for randomized controlled trials of the shoulder. 95% confidence intervals are shown
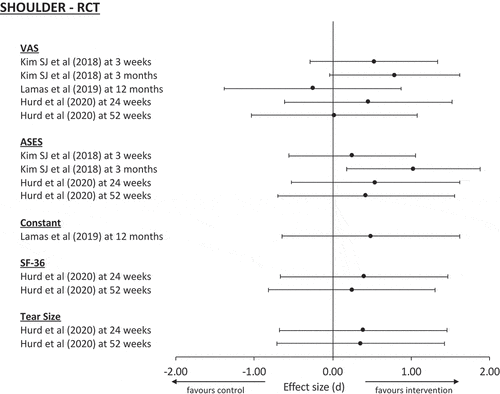
Figure 4. Hedges d effect sizes are shown for the pre-post mean difference in each outcome between intervention and control groups for non-randomized controlled trials of the shoulder. 95% confidence intervals are shown
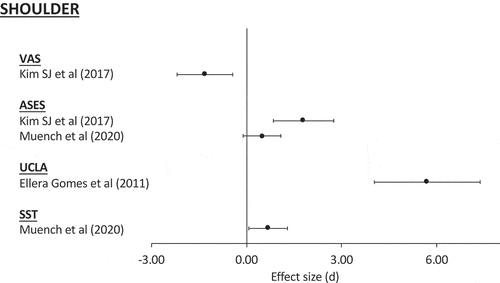
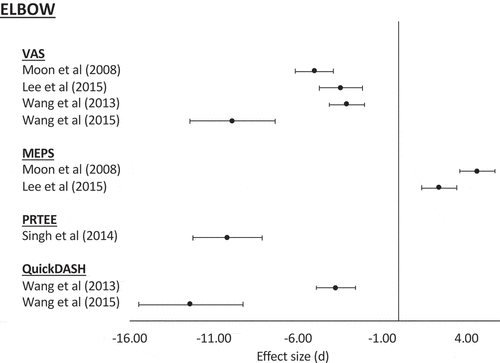
Figure 5. Hedges d effect sizes are shown for the pre-post mean difference in each outcome between intervention and control groups for non-randomized controlled trials of the elbow. 95% confidence intervals are shown