
Figures & data
Figure 1. Three types of measurements for flow-based ROA. Free Receptor Assay: can be measured using a fluorescent conjugated competitor of the therapeutic or a directly labeled therapeutic to detect unbound. Bound Receptor Assay: can be measured using a specific anti-therapeutic antibody. Total Receptor Assay: can be measured using a non-competing antibody or saturating amount of unlabeled therapeutic.
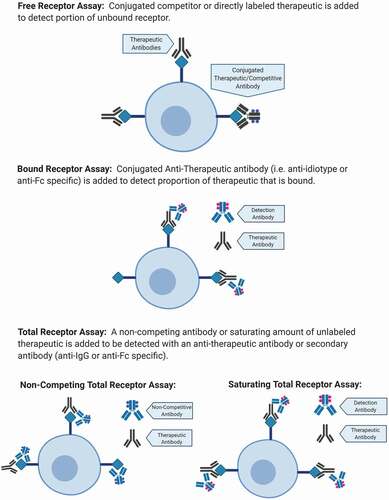
Figure 2. A. Labeled therapeutic spiked into the surrogate sample at saturating concentration. The histogram on the right side shows a saturated signal as indication of the therapeutic binding to all the targets on the cell surface. B. One or more concentration of therapeutic B spiked into the sample surrogate with saturating concentration of labeled therapeutic. The histogram on the right side shows a decrease in signal of the labeled therapeutic as indication of therapeutic B interference of target binding. C. Fluorescent-labeled therapeutic is spiked into the surrogate sample with pHrodo labeled therapeutic. If the target is internalized pHrodo is activated and a green-fluorescent signal will be detected. The fluorescent-labeled therapeutic will bind the target on the surface of the cells.
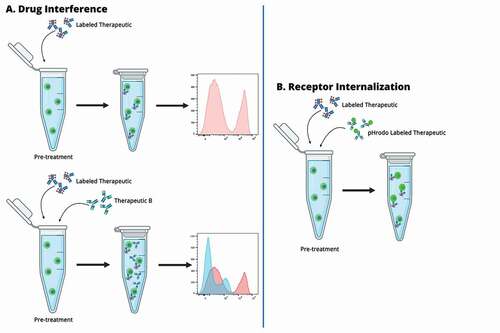
Table 1. Flow cytometry panel design and RO calculation
Table 2. ROA targets, development stage, and purposes
Table 3. ROA design scheme and considerations
Table 4. Validation parameters, samples, and acceptance criteria