
Figures & data
Table 1. Subject demographics (Safety set).
Figure 1. Mean (±SD) linear (a) and semilogarithmic (b) serum concentration-time profiles (Safety analysis set).
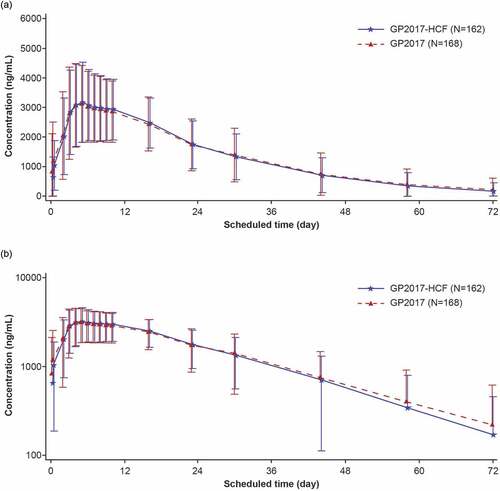
Figure 2. Forest plot of PK endpoints (PK analysis set).
Table 2. Comparison of the PK parameters of GP2017-HCF and GP2017 (PK analysis set).
Table 3. PK comparability by ADA subpopulation (PK analysis set).
Table 4. Summary of immunogenicity results (Safety analysis set).
Table 5. TEAEs by primary system organ class and preferred term (at least 2% of subjects in any treatment group) (Safety set).
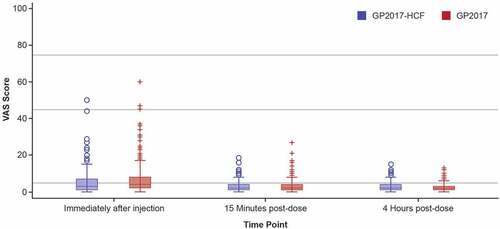
Figure 3. Box plot of VAS scores.
Supplemental material