Figures & data
Table 1. Scope of drug substance manufacturing changes across Roche (v0.1 and v0.2) and GBT processes.
Table 2. Outline of the scope of the comparability assessments performed for inclacumab to date.
Table 3. Routine testing summary for comparability.
Table 4. Extended characterization summary for comparability.
Table 5. In vitro and in vivo testing for comparability.
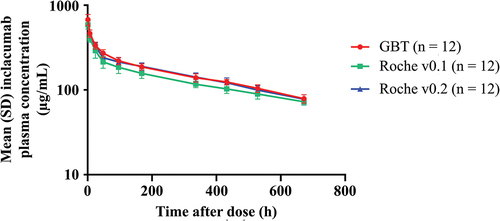
Figure 1. Male rats were administered a single intravenous dose of inclacumab from GBT, Roche v0.1, or Roche v0.2 production processes (30 mg/kg). The plasma concentration of inclacumab in micrograms per milliliter on a logarithmic scale is plotted versus time in hours after dosing. Data points show the mean plasma concentration from 12 samples per group, with error bars representing standard deviation. The lines for all three process materials are closely parallel to each other, decreasing from approximately 600 to 700 μg/mL 1 hour after the dose to approximately 70 to 80 μg/mL 672 hours the after dose. Comparisons of GBT material to Roche v0.2 material and Roche v0.2 material to Roche v0.1 material resulted in 90% CIs of the Cmax, AUClast, and AUC0-∞ ratios within the bioequivalence limits of 80% to 125%. AUC0–∞, area under the concentration–time curve from time 0 to infinity; AUClast, area under the concentration–time curve from time 0 to the time at which the last quantifiable concentration was observed; Cmax, maximum plasma concentration; CI, confidence interval; GBT, Global Blood Therapeutics; SD, standard deviation.