Figures & data
Figure 1. Patient disposition. aSafety analysis set defined as all patients who received ≥1 dose of study drug during the study observation period. bMost common reasons for discontinuation (≥2% in any group). cFull analysis set defined as all patients who received ≥1 dose of study drug during the study observation period and had ≥1 post-dose assessment of any of the effectiveness endpoints.
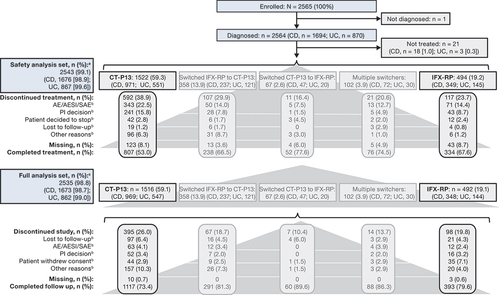
Table 1. Population characteristics and drug utilization patterns (safety analysis set).
Table 2. Summary of TEAEs (safety analysis set).
Table 3. Summary of all-causality TEAEs (SOC and PT ≥ 2% of patients in either cohort) (safety analysis set).a
Figure 2. Rates of clinical remissiona over time following treatment with CT-P13 and IFX-RP for patients with IBD overall, (a) and (b), respectively, and by disease type (CD and UC), (c) and (d) respectively (full analysis set). aBased on physician assessment.
Figure 3. Change in disease status over time for patients with IBD overall (CD and UC) treated with (a) CTP13 and (b) IFX-RP (full analysis set). aChange from baseline to analysis timepoint = (mild disease to mild disease) + (mild disease to moderate disease) + (mild disease to severe disease) + (moderate disease to moderate disease) + (moderate disease to severe disease) + (severe disease to severe disease). bChange from baseline to analysis timepoint = (clinical remission to mild disease) + (clinical remission to moderate disease) + (clinical remission to severe disease).