
Figures & data
Figure 1. Participant disposition.
PDS, pharmacodynamics analysis set; PKS, pharmacokinetics analysis set; SAS, safety analysis set.
*Three participants from the US-denosumab group discontinued study participation before receiving treatment due to randomization by mistake, participant decision, and physician decision.
Table 1. Participant demographics and baseline characteristics.
Figure 2. Geometric mean ratios and 90% CI of primary PK parameters.
AUCinf, area under the serum concentration–time curve measured from the time of dosing and extrapolated to infinity; AUClast, area under the serum concentration–time curve measured from the time of dosing and extrapolated to the last measurable concentration; CI, confidence interval; Cmax, maximum observed serum concentration.
Figure 3. Mean drug serum concentration–time profiles. (a) Mean (SD) linear scale. (b) Mean, semi-logarithmic scale.
SD, standard deviation.
Linear scale: no lower SD whisker displayed if mean SD < 0, given it is biologically implausible.
Semi-logarithmic scale: values of 0 for which no log transformation is defined are presented as 1.
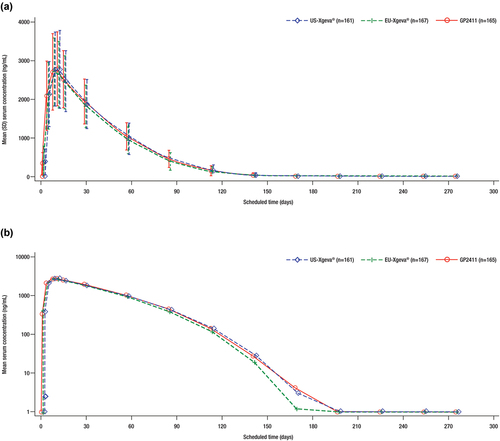
Table 2. Pharmacokinetic endpoints.
Figure 4. Geometric mean ratio and 95% CIs of AUEC of percentage change from baseline in serum CTX.
AUEC, area under the effect–time curve; CI, confidence interval; CTX, carboxy-terminal crosslinked telopeptide of type I collagen; ref, reference product.
Figure 5. Change from baseline in PD endpoints. (a) serum CTX levels. (b) serum PINP levels.
CTX, carboxy-terminal crosslinked telopeptide of type I collagen; PD, pharmacodynamics; PINP, procollagen type I N-propeptide; SD, standard deviation.
A lower SD whisker is not displayed if mean SD <-100%, given it is biologically implausible.
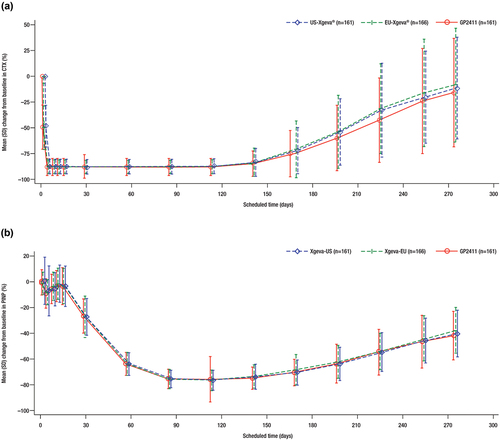
Table 3. Treatment-emergent adverse events reported in ≥2% of participants in any treatment group.
Table 4. Incidence of ADAs and immunogenicity outcomes.
Data availability statement
Data from this study are available from the corresponding author on request.