
Figures & data
Figure 1. Direct agent network hypothesis.
Legend: Arrow: career transfer event Solid circle: dyad of cities with enhanced probability for interlocal collaboration where city manager(s) serves in City Y from year t to year t+n; Empty circle: city with baseline probability for interlocal collaboration
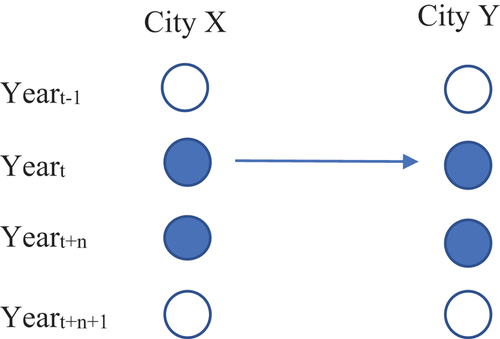
Figure 2. Indirect agent network hypothesis.
Legend: Solid Arrow: career transfer event Solid circle: dyad of cities with enhanced probability for interlocal collaboration where city manager(s) serves in City Z from year t+n+1 to year t+m; Empty circle: city with baseline probability for interlocal collaboration; Arc: indirect network connection
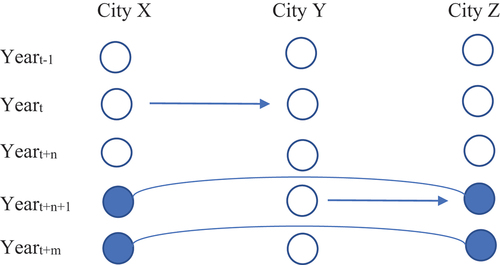
Table 1. Measurement and data sources.
Table 2. Descriptive statistics and correlation.
Table 3. Zero-inflated negative binomial models for ILAs.
Figure 3. Effects of direct and indirect ANC on ILAs.
Note: Based on model 5 in , the predictive margins (predicted number) of ILAs are generated on each value of Direct ANC and Indirect ANC.
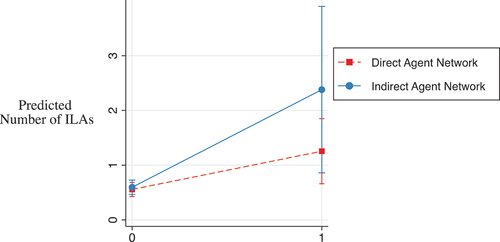
Table A1. Zero-inflated negative binomial models for ILA formation.
Data availability statement
The data is available in https://doi.org/10.7910/DVN/RP09MJ.