Figures & data
Table 1. Vignette dimensions and their levels.
Table 2. Descriptive statistics.
Table 3. Balance tests: probit estimations.
Figure 1. Full sample analysis.
Note: The figure plots the coefficients on the binary variables indicating experimental assignments (dots) and the 90% (thick horizontal lines) and 95% (thin horizontal lines) confidence intervals based on Column 1 in . For each dimension, one level is used as the baseline category.
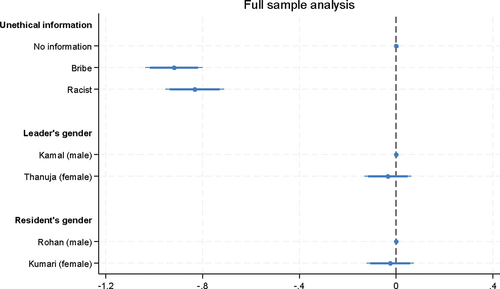
Table 4. OLS estimations with and without covariates.
Table 5. Subsample analysis by leader’s gender.
Figure 2. Subsample analyses (conditional on leader’s/village resident’s gender).
Note: The figure plots the coefficients on the binary variables indicating experimental assignments and the 90% and 95% confidence intervals. The figure on the left is based on Columns 1 and 2 in . The figure on the right is based on Columns 1 and 2 in .
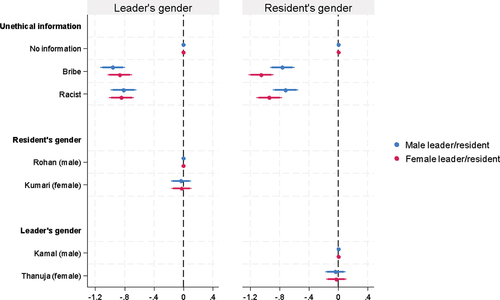
Table 6. Subsample analysis by village resident’s gender.
Figure 3. Subsample analyses: conditional on pair of leader’s and resident’s gender.
Note: The figure plots the coefficients on the binary variables indicating experimental assignments and the 90% and 95% confidence intervals. The figure on the left is based on Columns 1 and 2 in . The figure on the right is based on Columns 4 and 5 in .
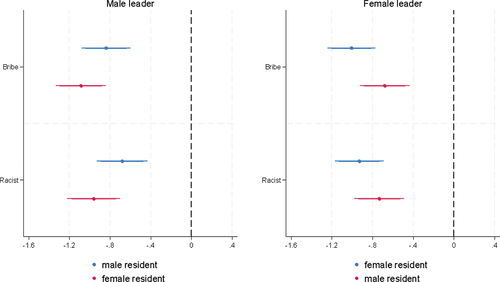
Table 7. Subsample analysis by pairs of leader’s and resident’s gender.
Table A1. Target population and sample.