Figures & data
TABLE 1. Qualitative ethnographic methods used.
TABLE 2. Participant demographics.
TABLE 3. Young adult and retiree descriptions of photos taken.
FIGURE 1. How photos were categorised by 22 young adult participants (n = 850 photos). Participants could choose more than one photo category to describe a photo.
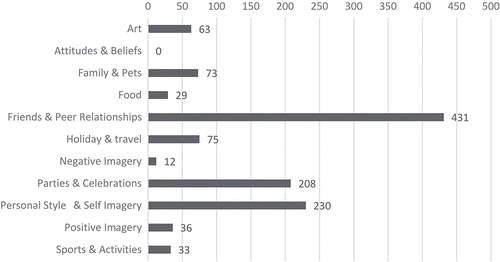
FIGURE 2. (a) Personal style and self image: Leaving School (Participant Kirsty18); (b) Personal style and self image: Work (Participant John69); (c) Parties & Celebrations (categorisation exercise).
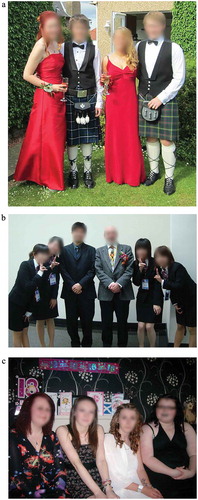
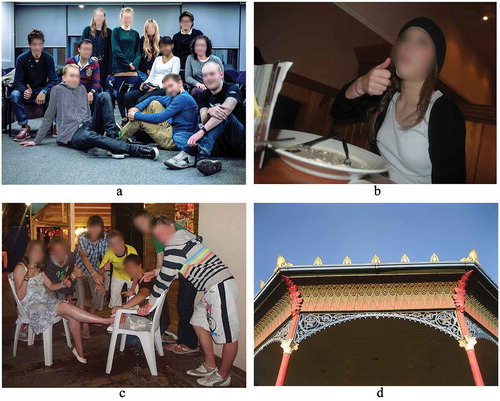
FIGURE 3. (a) Friends (categorisation exercise); (b) Food (categorisation exercise); (c) Something has Happened (Participant Rebecca21); (d) Buildings & History (Participant Moira63).