Figures & data
Figure 1. Schematic illustration to depict replication fork dynamics upon RS
Upon encountering RS, the replicating fork has two basic response pathways to choose from – the RSR and TLS. Ideally, in RSR, the replicating fork slows replication and reverses into a reversed ‘chicken foot’ conformation. The reversed fork structure can then (A) recruit nucleases to initiate DNA repair and/or contribute to replication restart or (B) due to excessive nuclease coupled fork degradation can lead to a ‘hyper-resected’ fork that ultimately results in fork collapse. Another possibility is that the stressed fork can avoid fork reversal and (C) continue with replication despite stress by either firing new replication origins or by initiating re-priming few bases downstream all of which can result in the formation of ssDNA gaps which can contribute to reduced cell fitness and trigger cell death pathways. On the contrary, the replicating fork may activate the TLS pathway to overcome the RS barrier by either (D) promoting unrestrained replication without ssDNA gaps by the virtue of its gap suppression (GS) function or may choose to (E) bypass any stress-induced lesion to favor continued replication which is then (F) revisited post replication to perform repair and fill in the gap left near the site of DNA lesion. TLS thus acts as an alternative pathway to the RSR that aids replication and favors cell survival.
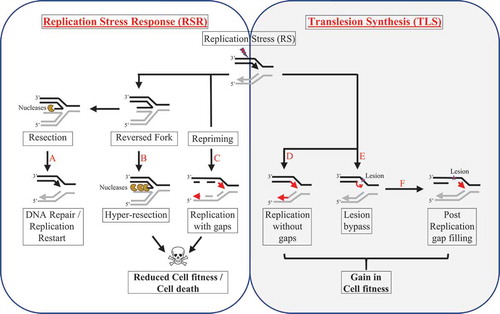
Figure 2. The role of oncogene-induced RS in the development of cancer
Oncogene activation is an endogenous source of RS and can induce RSR to restrict active replication which often acts as an anti-cancer barrier to cancer proliferation. Oncogene-induced replication resistance is primarily overcome by additional secondary mutations including mutations that abrogate the checkpoint responses or in tumor suppressor genes that favor tumorigenesis or by activation of TLS that blunts the oncogene-induced RSR to promote replication and gain in cellular survival.
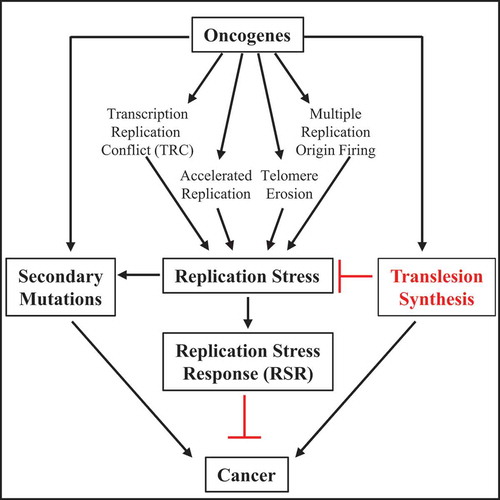
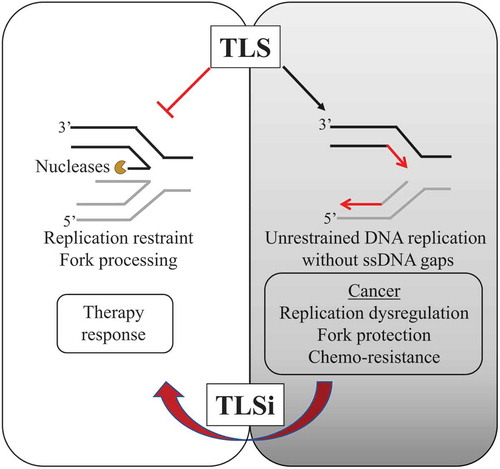
Figure 3. Schematic illustration to depict TLS-induced chemo-resistance in cancer
Anti-cancer therapy involves drugs (such as ATRi, WEE1i, and PARPi) that directly affect DNA replication and often result in the formation of genome-wide ssDNA gaps that contribute to genotoxicity and kills the cancer cell. However, one mechanism by which chemo-resistance develops is by activation of pathways that suppress these ssDNA gaps, such as TLS. TLS can not only promote replication bypass and post-replication gap filling but can also contribute to unrestrained RGS during the S phase of the cell cycle and subvert the negative consequences associated with the use of chemotherapeutics.
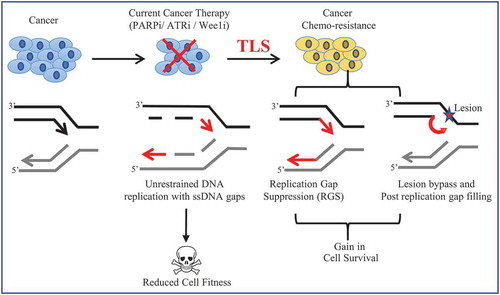
Figure 4. Model proposing TLS as a new evolving target for cancer therapy
Based on the new defined role for TLS as a gap suppression mechanism [Citation67], novel therapies to effectively target TLS could be proposed that counter TLS-induced unrestrained replication fork dynamics and TLS-dependent tumorigenesis.