
Figures & data
Figure 1. Examples of biodiversity perception drawings for two children (both 9 years old), one from the intervention group and one from the control group, before and after the programme of activities.
Figure 2. Mean number of drawn taxa before/after the activities by intervention and control groups. Error bars represent Standard Error of the Mean (SEM).
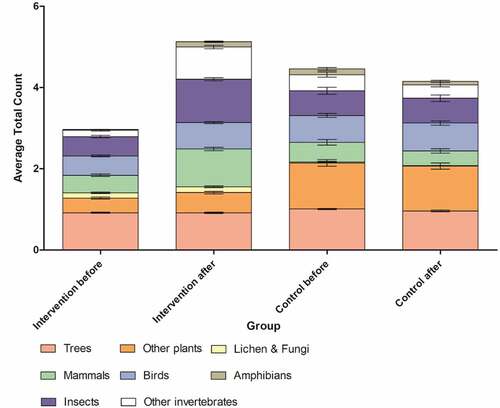
Table 1. Assessing significant change in the number of drawn organisms within each category for the intervention and control group before and after the intervention.
Figure 3. The percentage of children’s perception of biodiversity compared to actual biodiversity present in school grounds in the (a) intervention group and (b) control group children’s drawings before (B) and after (A). Error bars represent SEM. The ± represent the larger proportion of children over/ under perceiving the biodiversity present in school grounds.
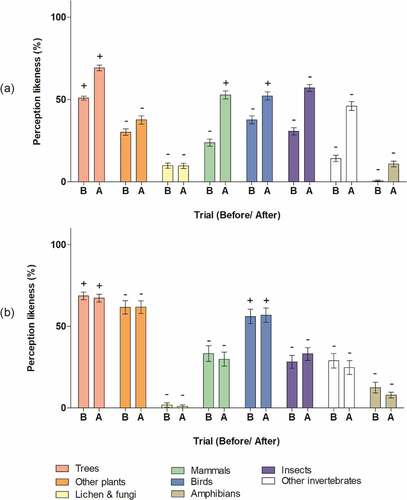
Table 2. Assessing significant change in biodiversity perception likeness to actual biodiversity in school grounds for the intervention and control group before and after the intervention.
Table 3. Mean scores of the wellbeing and resilience measures for intervention and control group children.
Figure 4. Mean percentage change of wellbeing and resilience scores in all intervention group children and in intervention group children that had initially low baseline scores. Error bars represent SEM.
Appendices.docx
Download MS Word (15.6 KB)Data Availability Statement
Data can be made available by request to the corresponding author.