Figures & data
Figure 1. Distribution (%) of Teaching Pedagogy in the CCE Program.
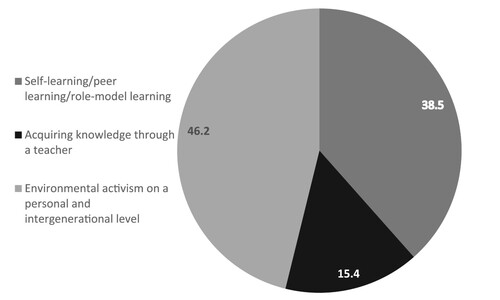
Figure 2. The winning logo in the democratic elections held at the school. Logo slogan: The earth is hot and there is no time to slow down.
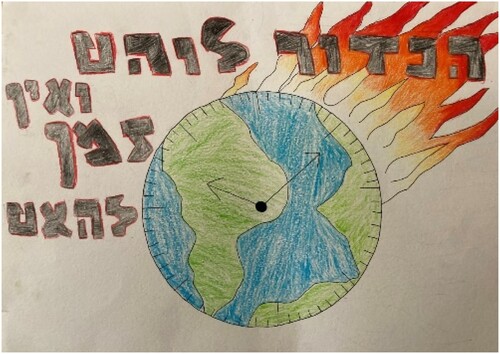
Figure 3. Distribution of personal activist projects designed to lead to behavioral change at the individual level.
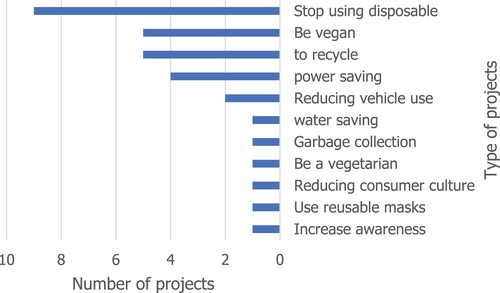
Figure 4. A mobile book library based on a wooden cart built by the students at the school.
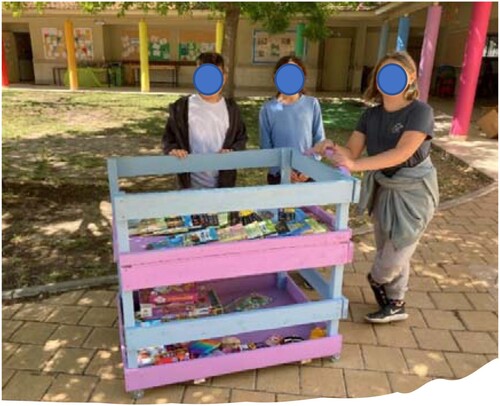
Figure 5. The beginning of a green wall built by the students.
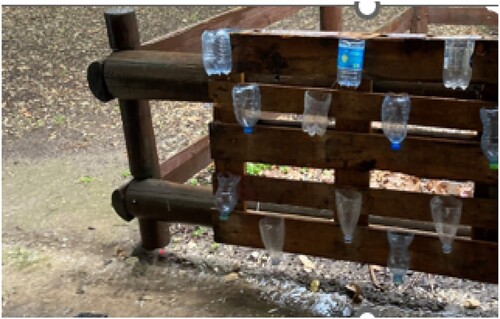
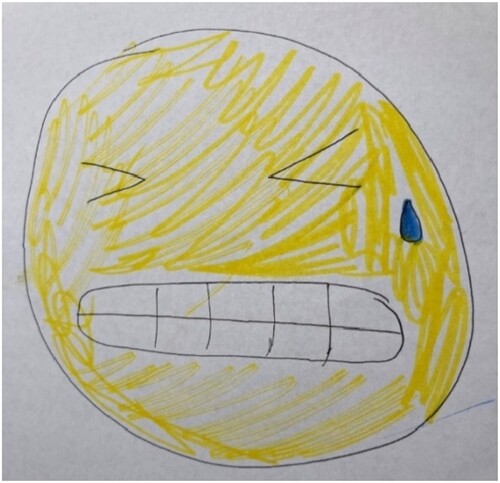
Figure 6. A sad face as a way of symbolizing the feeling toward climate change.
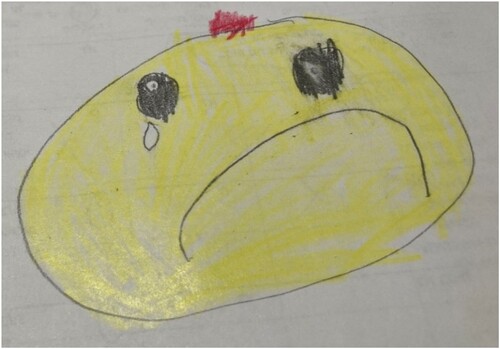
Figure 7. A face that represents the earth and the feeling of heat emitted from it as a result of the sun heating it.
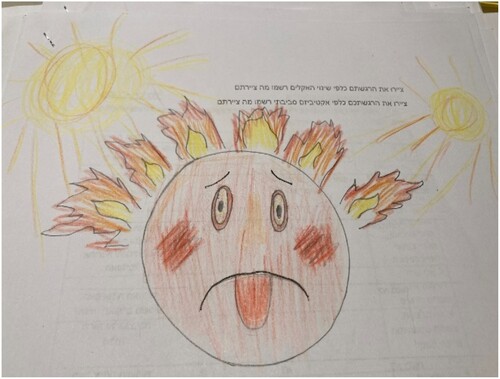
Figure 8. The earth is divided. To the right there are trees, shrubs and happy children (in green colors) and next to it is written, ‘What could have happened’. On the left there are buildings and factories (in black) and a bonfire (in yellow) with the text, ‘What is going to happen’.
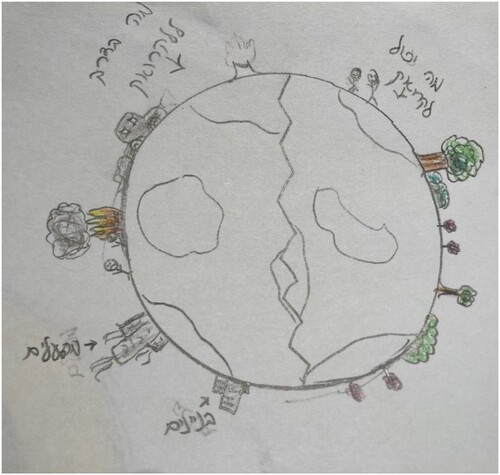
Figure 9. An example of a drawing that exemplifies the students’ feelings toward climate change (at the end of the year).