Figures & data
Figure 1. Examples of probability density functions based on beta distributions used to define variability of input parameters. Left: airtightness value for standard new constructions [1/h], Center: room area for bedrooms [m2], Right: window tightness class for old buildings (is consequently rounded to integer value).
![Figure 1. Examples of probability density functions based on beta distributions used to define variability of input parameters. Left: airtightness value for standard new constructions [1/h], Center: room area for bedrooms [m2], Right: window tightness class for old buildings (is consequently rounded to integer value).](/cms/asset/0ad534c5-0023-434d-9527-5aa4ecc6497e/tjov_a_2198788_f0001_c.jpg)
Table 1. Summary of all relevant input parameters and the corresponding number of defined probability density functions (PDFs) and what the selection of the PDF depends on {in curly brackets}.
Table 2. Assumptions of reasonable time interval between occupant intervention.
Figure 2. Window airing requirement for the bedroom of a new multifamily building (see text). Left: Evolution of time average of CO2 concentration without and with airing for the median case, and for selected percentiles without airing. Right: Histogram of window airing interval if Austrian limit value is not to be exceeded.
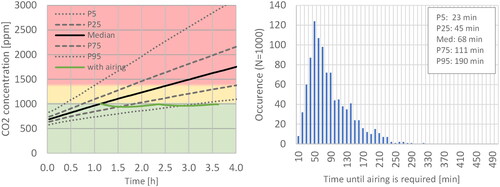
Figure 3. Window airing requirement for a 50 m2 living room of a new multifamily building (see text). Left: Evolution of time average of CO2 concentration without and with airing for the median case, and for selected percentiles without airing. Right: Histogram of window airing interval if Austrian limit value is not to be exceeded.
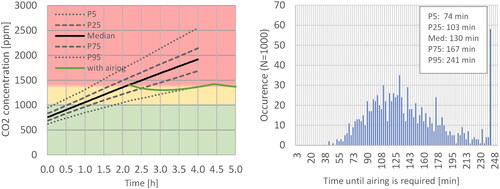
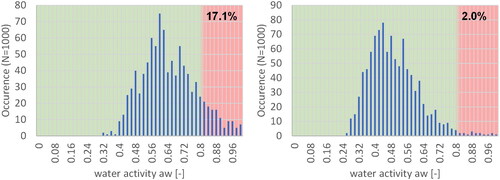
Figure 4. Histogram for number of cases with different water activity results. Values >0.8 correspond to cases with substantial mould risk. Left: Result for standard newly constructed multifamily building in Vienna. The remaining parameters are defined by the stored PDFs. Right: Results for newly constructed multifamily building in Vienna with minimal thermal bridges (Passive House standard) and low humidity load assumption.