Figures & data
Figure 1. (a, b) Computational domain and boundary conditions in the present study, (c) poly-hederal grid applied in the present study, (d) validation lines provided by previous wind-tunnel study (Kosutova et al., Citation2019).
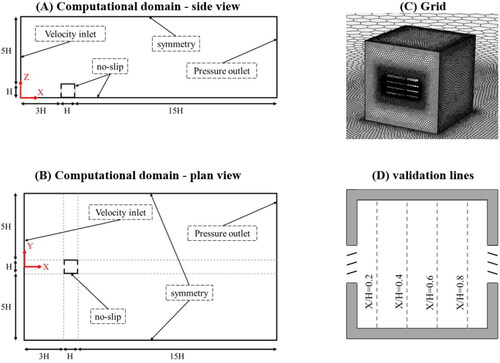
Figure 2. Grid-sensitivity analysis for four vertical lines inside the test room for the cross-ventilation case (x/H lines are illustrated in ).
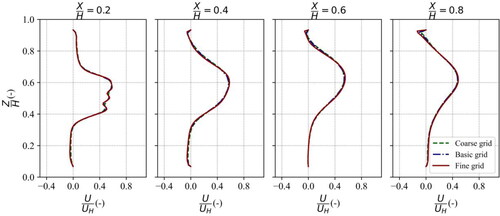
Figure 3. Top: flow directions considered, and, bottom: opening geometries considered.
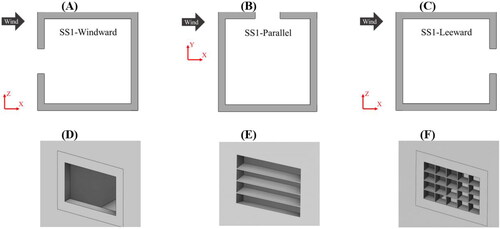
Figure 4. Validation of calculated mean streamwise velocity profiles inside the room compared with wind tunnel study (Kosutova et al., Citation2019).
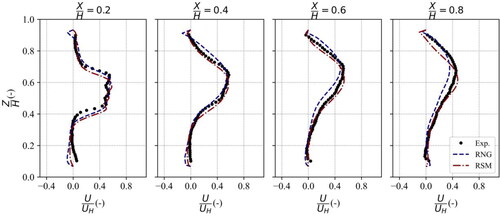
Figure 5. Mean streamlines and mean static pressure contours.
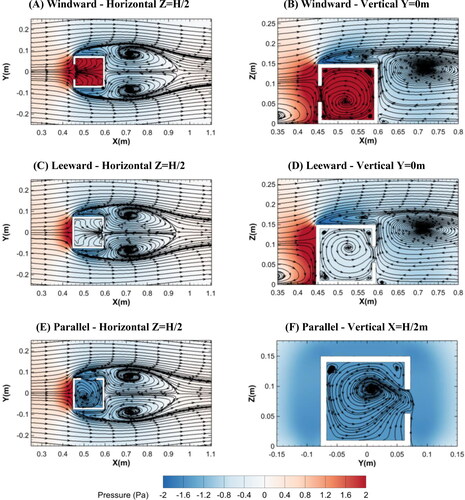
Figure 6. Schematic demonstration of the flow around the surface-mounted cube (Martinuzzi & Tropea, Citation1993).
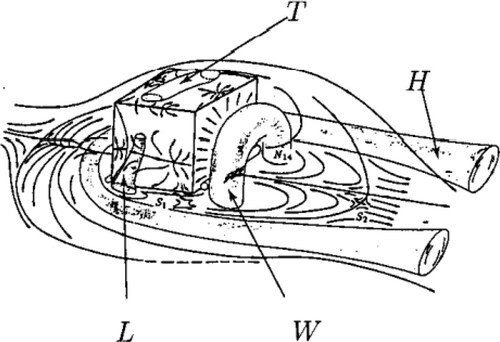
Figure 7. Age of Air contours at vertical surface at the center of the room.
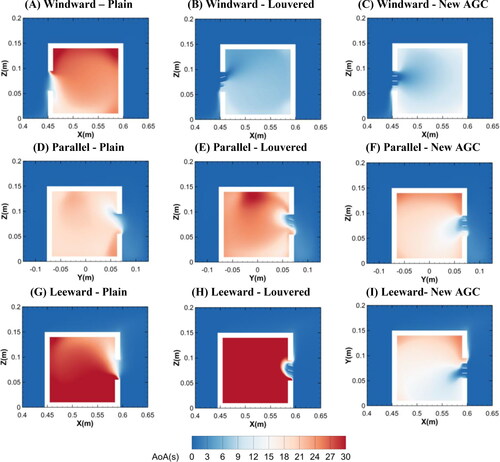
Figure 8. Mean streamlines and turbulent intensity contours on windward and leeward opening.
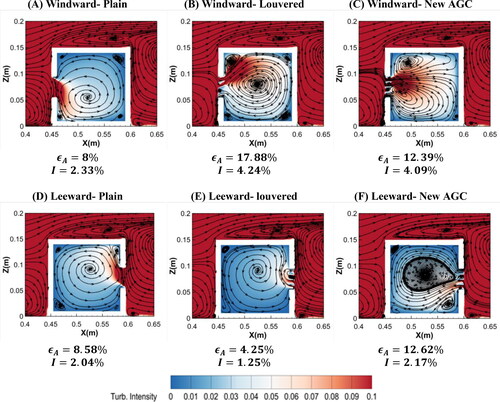
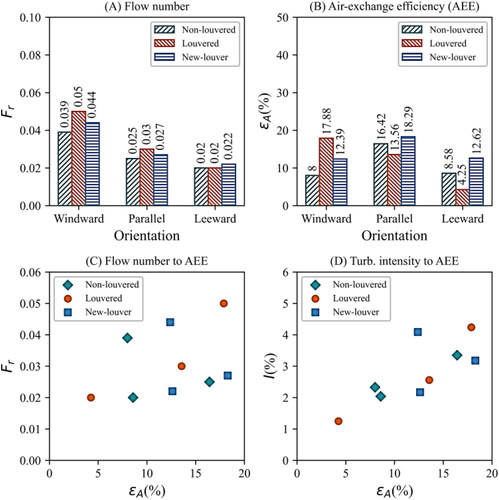
Figure 9. (a) Flow number and (b) air-exchange efficiency bar charts; (c) flow number to air-exchange efficiency, and (d) turbulent intensity to air-exchange efficiency scatter plots.