Figures & data
Table 1. Summary descriptive of the IND model inputs and disease incidence output for selected contaminantsTable Footnote+.
Table 2. Summary descriptive of the ID model inputs, for selected contaminantsTable Footnote+.
Figure 1. Recommended representative concentrations for the 45 contaminants included in the analysis. In alphabetical order. Central estimate and 95% CI of distribution in black. Datasets in parenthesis. *Radon in Bq m−3. **Bioaerosols in CFU m−3.
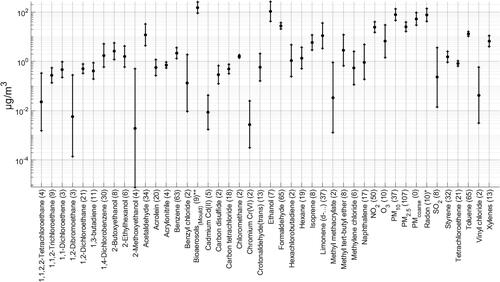
Figure 2. Pooled effect factors. Highest to lowest DALY median. Central estimate and 95% CI of distribution in black. *Radon in DALY.(10−9Bq-intake)−1. **Bioaerosols in DALY.(10−9CFU-intake)−1
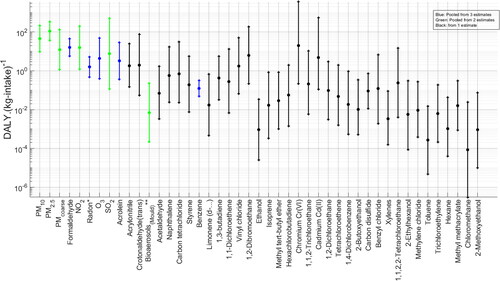
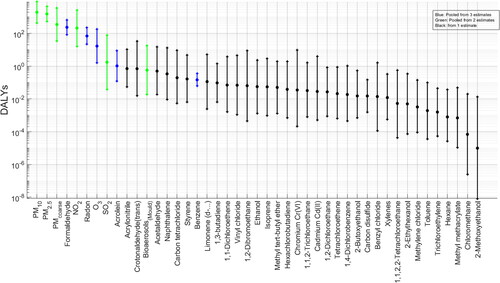
Figure 3. Pooled DALYs. Highest to lowest median. Central estimate and 95% C.I. of distribution in black.